29
/
en
AIzaSyAYiBZKx7MnpbEhh9jyipgxe19OcubqV5w
April 1, 2024
206579
Nepal
NPL
true
2
1
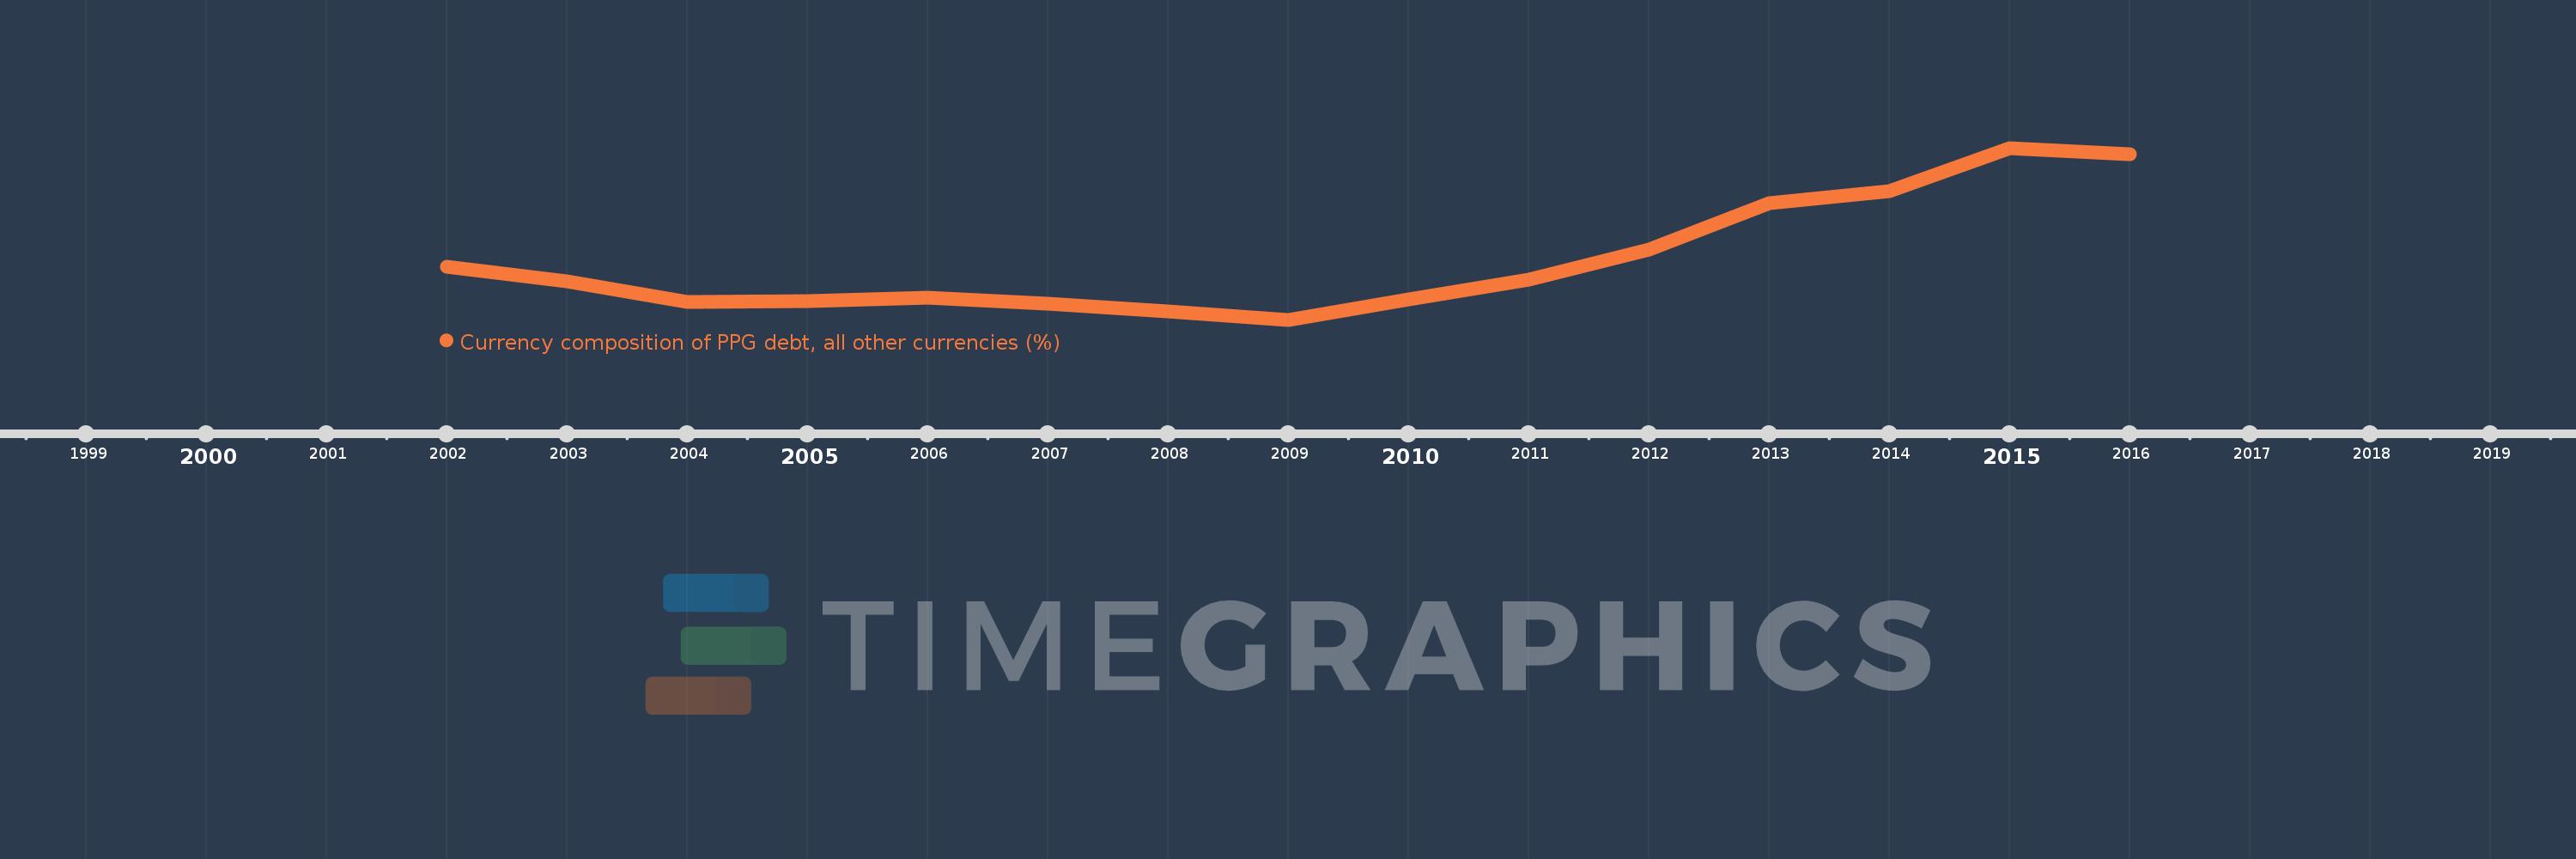
Currency composition of PPG debt, all other currencies (%)
2016,2015,2014,2013,2012,2011,2010,2009,2008,2007,2006,2005,2004,2003,2002
This statistics in other country:
Timeline:
This timeline shows a graph from 2002 to 2016 of Nepal. No data until 2001. Number of actual observations by date: 15.
Source name:
World Development Indicators
Source organization:
World Bank, International Debt Statistics.
Categories, topics:
External Debt
Last updated:
apr 23, 2017
Indicators value changes by year
At the date of observation
Value
Absolute change
Change from previous value
jan 1, 2002
1.766
+1.766
0.0%
jan 1, 2003
1.464
-0.302
-17.09%
jan 1, 2004
1.051
-0.413
-28.21%
jan 1, 2005
1.064
+0.013
1.22%
jan 1, 2006
1.135
+0.071
6.67%
jan 1, 2007
1.005
-0.129
-11.4%
jan 1, 2008
0.857
-0.149
-14.78%
jan 1, 2009
0.684
-0.172
-20.09%
jan 1, 2010
1.106
+0.421
61.58%
jan 1, 2011
1.501
+0.395
35.68%
jan 1, 2012
2.116
+0.615
41.0%
jan 1, 2013
3.056
+0.94
44.43%
jan 1, 2014
3.299
+0.243
7.96%
jan 1, 2015
4.187
+0.888
26.9%
jan 1, 2016
4.053
-0.134
-3.21%
Ranking of countries by current statistics by years


Comments: