29
/
en
AIzaSyAYiBZKx7MnpbEhh9jyipgxe19OcubqV5w
April 1, 2024
92044
British Virgin Islands
VGB
true
2
1
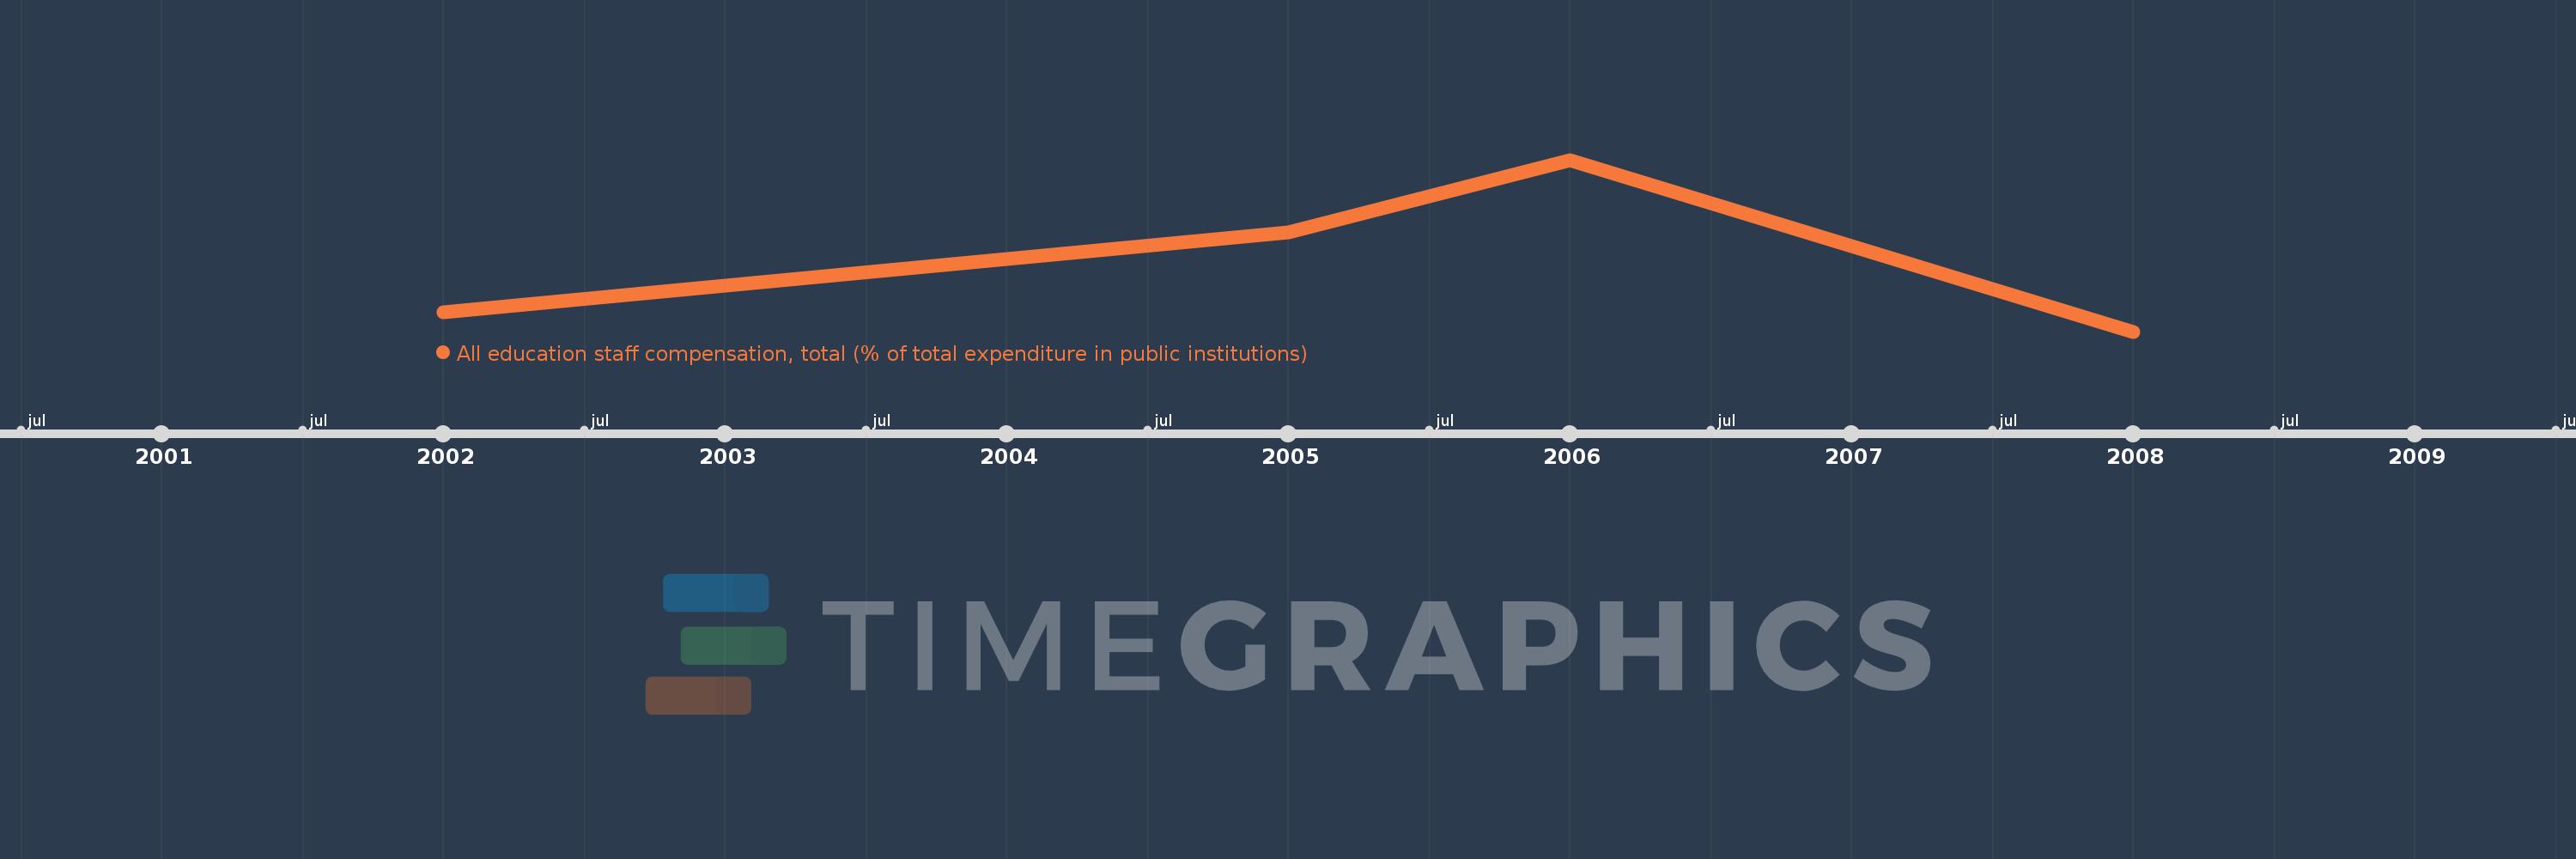
All education staff compensation, total (% of total expenditure in public institutions)
2008,2006,2005,2002
This statistics in other country:
Timeline:
This timeline shows a graph from 2002 to 2008 of British Virgin Islands. No data until 2001. Number of actual observations by date: 4.
Source name:
World Development Indicators
Source organization:
United Nations Educational, Scientific, and Cultural Organization (UNESCO) Institute for Statistics.
Categories, topics:
Education
Last updated:
apr 23, 2017
Indicators value changes by year
Minimum:
77.815
jan 1, 2008
Maximum:
99.343
jan 1, 2006
At the date of observation
Value
Absolute change
Change from previous value
jan 1, 2002
80.279
+80.279
0.0%
jan 1, 2005
90.297
+10.019
12.48%
jan 1, 2006
99.343
+9.046
10.02%
jan 1, 2008
77.815
-21.528
-21.67%
Ranking of countries by current statistics by years


Comments: