29
/
en
AIzaSyAYiBZKx7MnpbEhh9jyipgxe19OcubqV5w
April 1, 2024
236720
Serbia
SRB
true
2
1
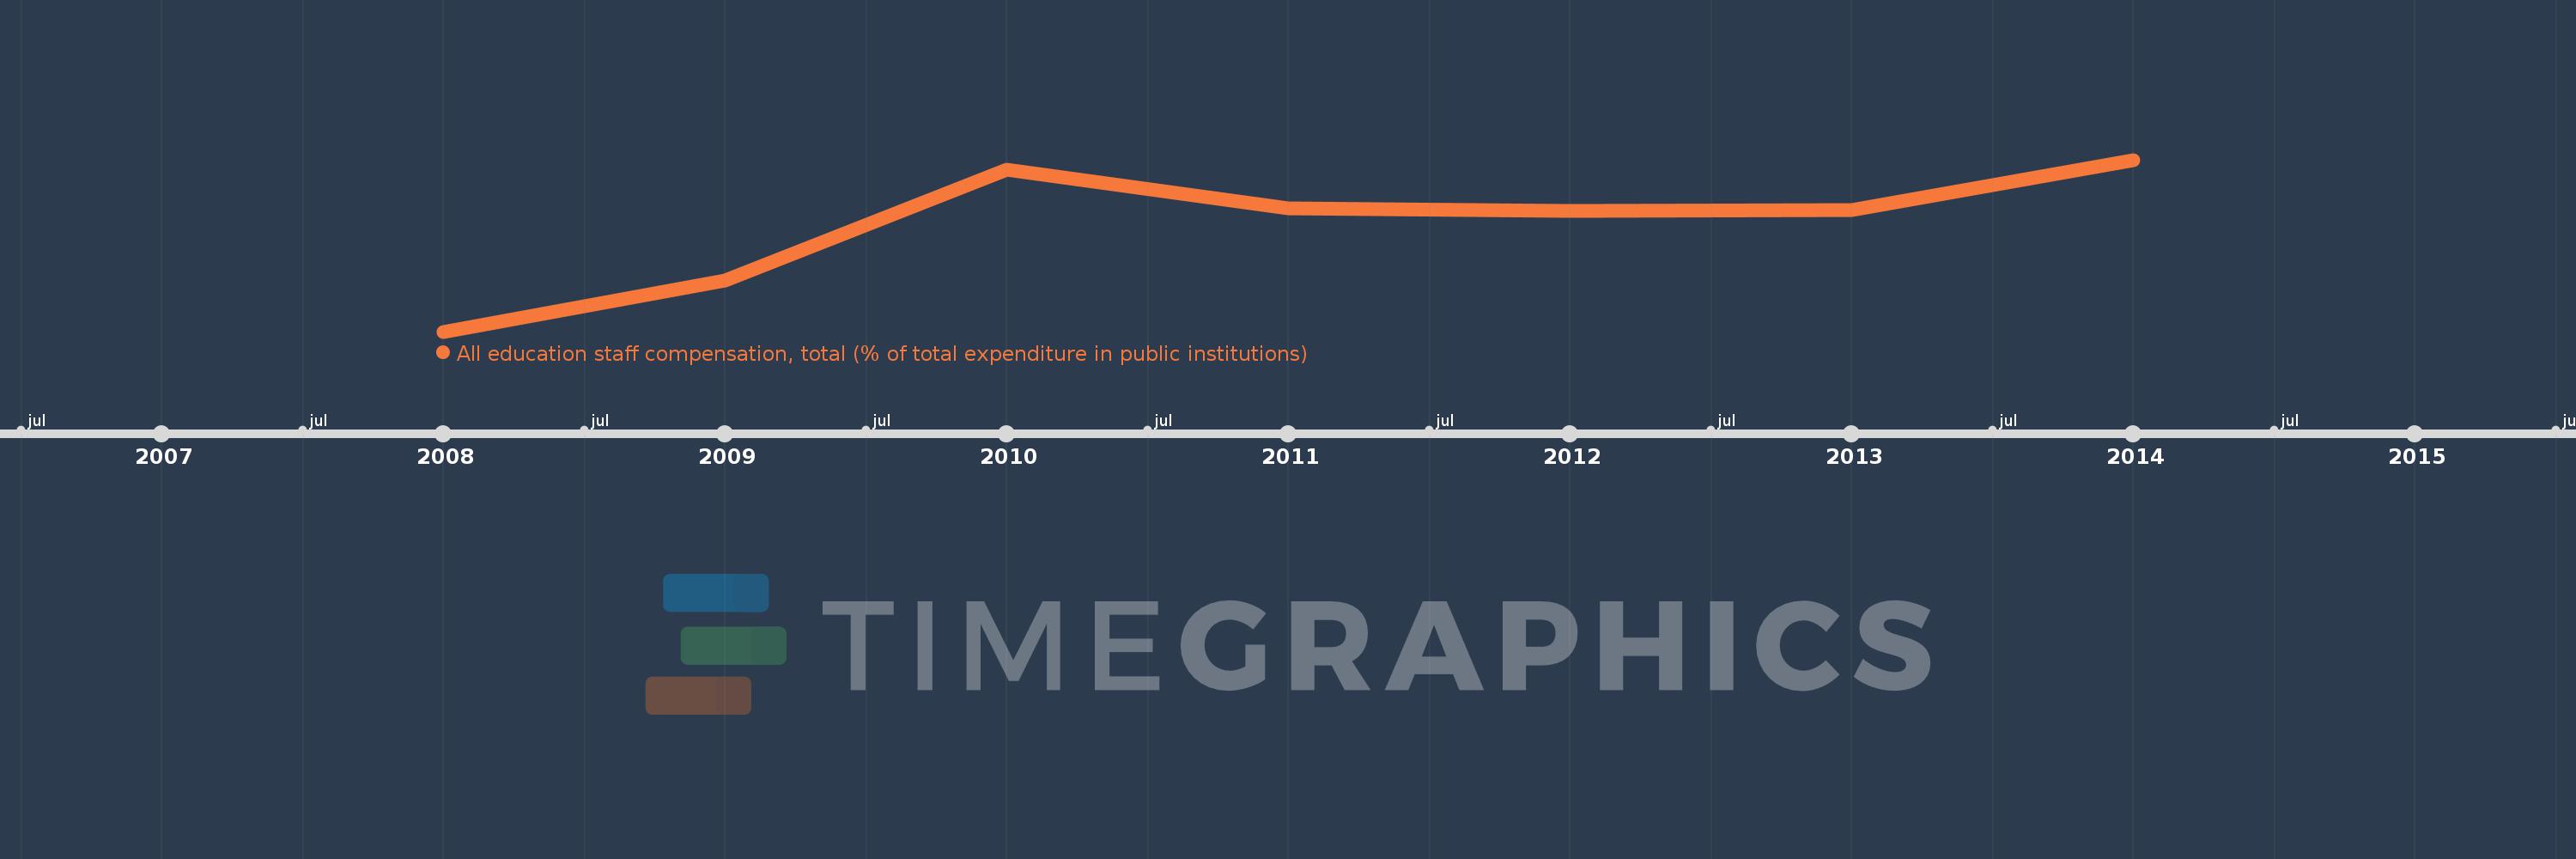
All education staff compensation, total (% of total expenditure in public institutions)
2014,2013,2012,2011,2010,2009,2008
This statistics in other country:
Timeline:
This timeline shows a graph from 2008 to 2014 of Serbia. No data until 2007. Number of actual observations by date: 7.
Source name:
World Development Indicators
Source organization:
United Nations Educational, Scientific, and Cultural Organization (UNESCO) Institute for Statistics.
Categories, topics:
Education
Last updated:
apr 23, 2017
Indicators value changes by year
Minimum:
71.622
jan 1, 2008
At the date of observation
Value
Absolute change
Change from previous value
jan 1, 2008
71.622
+71.622
0.0%
jan 1, 2009
73.071
+1.449
2.02%
jan 1, 2010
76.176
+3.105
4.25%
jan 1, 2011
75.089
-1.087
-1.43%
jan 1, 2012
75.009
-0.08
-0.11%
jan 1, 2013
75.055
+0.046
0.06%
jan 1, 2014
76.46
+1.405
1.87%
Ranking of countries by current statistics by years


Comments: