29
/
en
AIzaSyAYiBZKx7MnpbEhh9jyipgxe19OcubqV5w
April 1, 2024
224561
Poland
POL
true
2
1
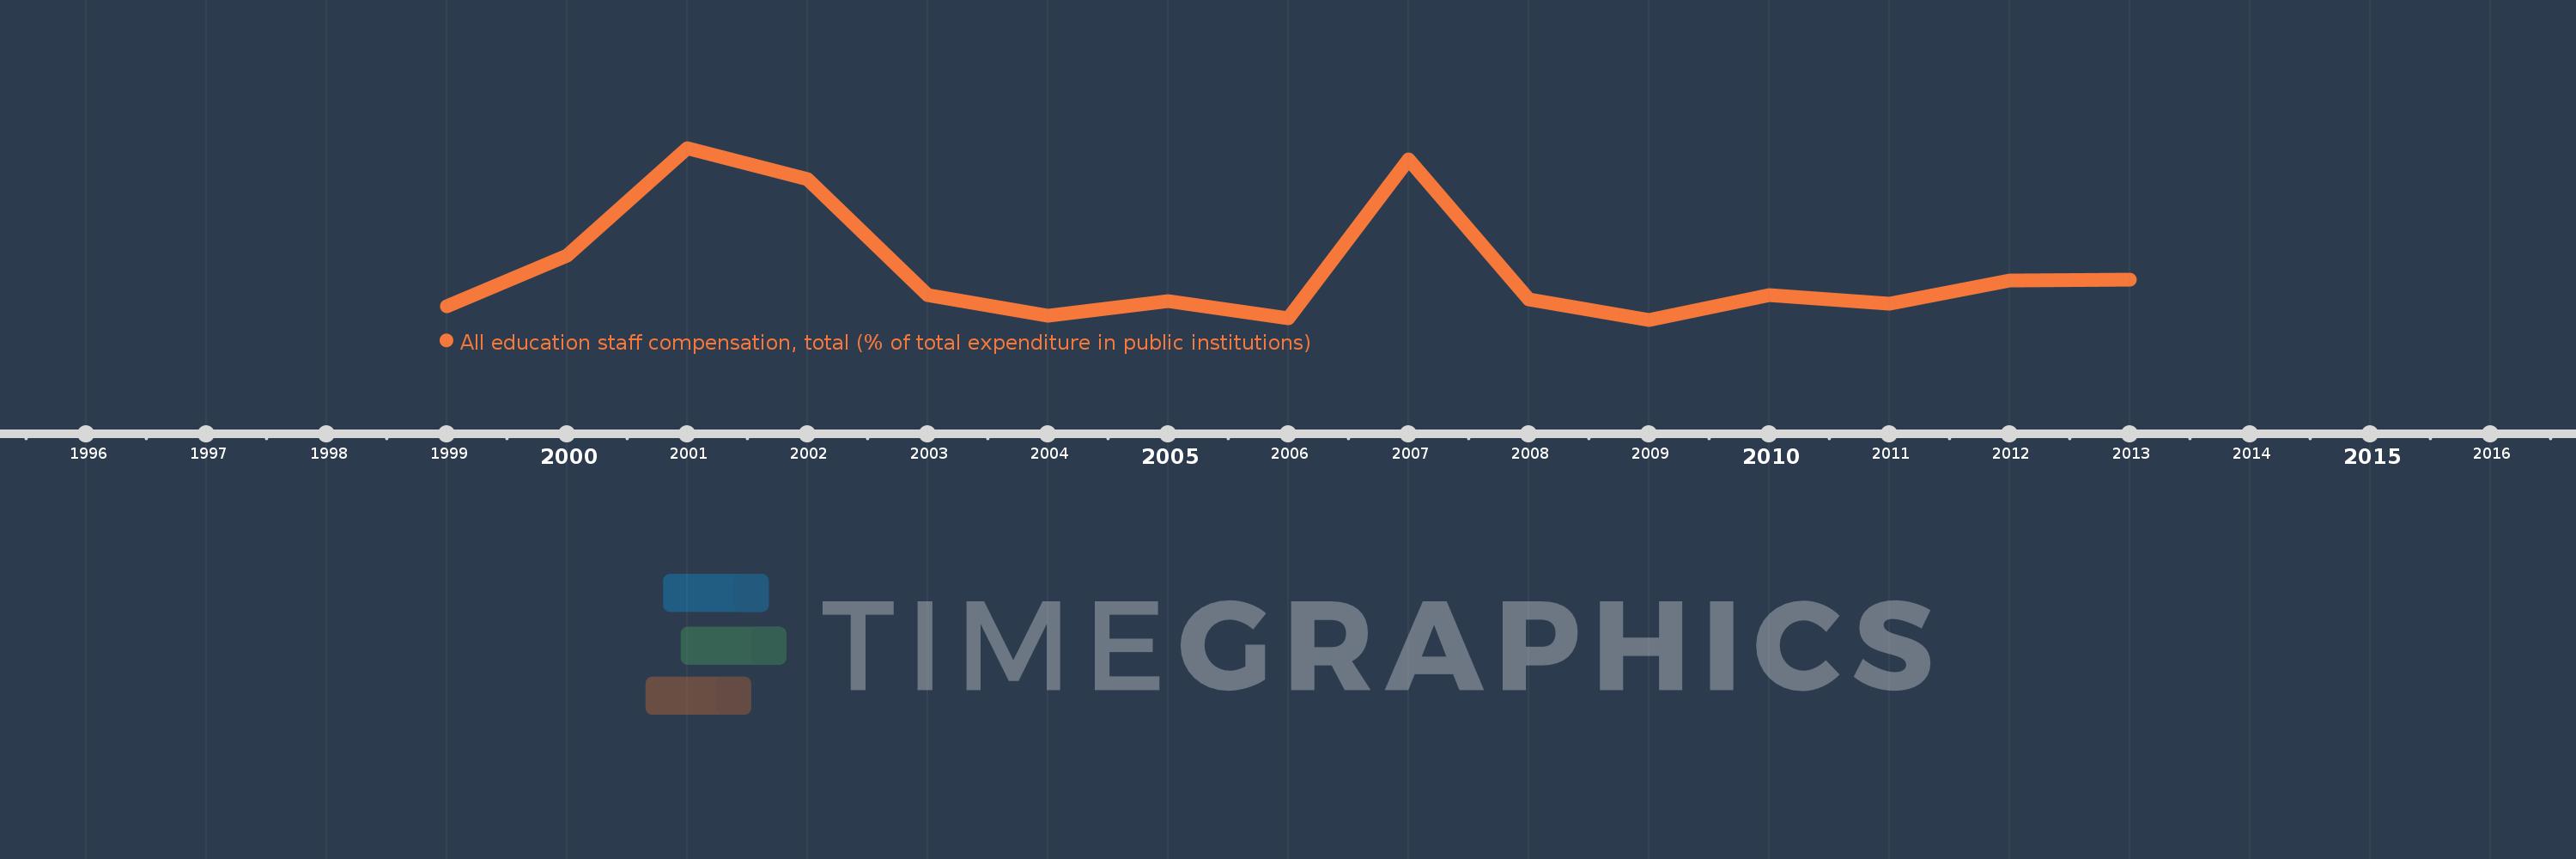
All education staff compensation, total (% of total expenditure in public institutions)
2013,2012,2011,2010,2009,2008,2007,2006,2005,2004,2003,2002,2001,2000,1999
This statistics in other country:
Timeline:
This timeline shows a graph from 1999 to 2013 of Poland. No data until 1998. Number of actual observations by date: 15.
Source name:
World Development Indicators
Source organization:
United Nations Educational, Scientific, and Cultural Organization (UNESCO) Institute for Statistics.
Categories, topics:
Education
Last updated:
apr 23, 2017
Indicators value changes by year
Minimum:
60.412
jan 1, 2009
Maximum:
70.345
jan 1, 2001
At the date of observation
Value
Absolute change
Change from previous value
jan 1, 1999
61.198
+61.198
0.0%
jan 1, 2000
64.137
+2.939
4.8%
jan 1, 2001
70.345
+6.209
9.68%
jan 1, 2002
68.552
-1.794
-2.55%
jan 1, 2003
61.814
-6.737
-9.83%
jan 1, 2004
60.653
-1.161
-1.88%
jan 1, 2005
61.492
+0.838
1.38%
jan 1, 2006
60.492
-0.999
-1.62%
jan 1, 2007
69.695
+9.203
15.21%
jan 1, 2008
61.574
-8.121
-11.65%
jan 1, 2009
60.412
-1.161
-1.89%
jan 1, 2010
61.836
+1.424
2.36%
jan 1, 2011
61.354
-0.482
-0.78%
jan 1, 2012
62.684
+1.329
2.17%
jan 1, 2013
62.739
+0.055
0.09%
Ranking of countries by current statistics by years


Comments: