29
/
en
AIzaSyAYiBZKx7MnpbEhh9jyipgxe19OcubqV5w
April 1, 2024
251629
St. Vincent and the Grenadines
VCT
true
2
1
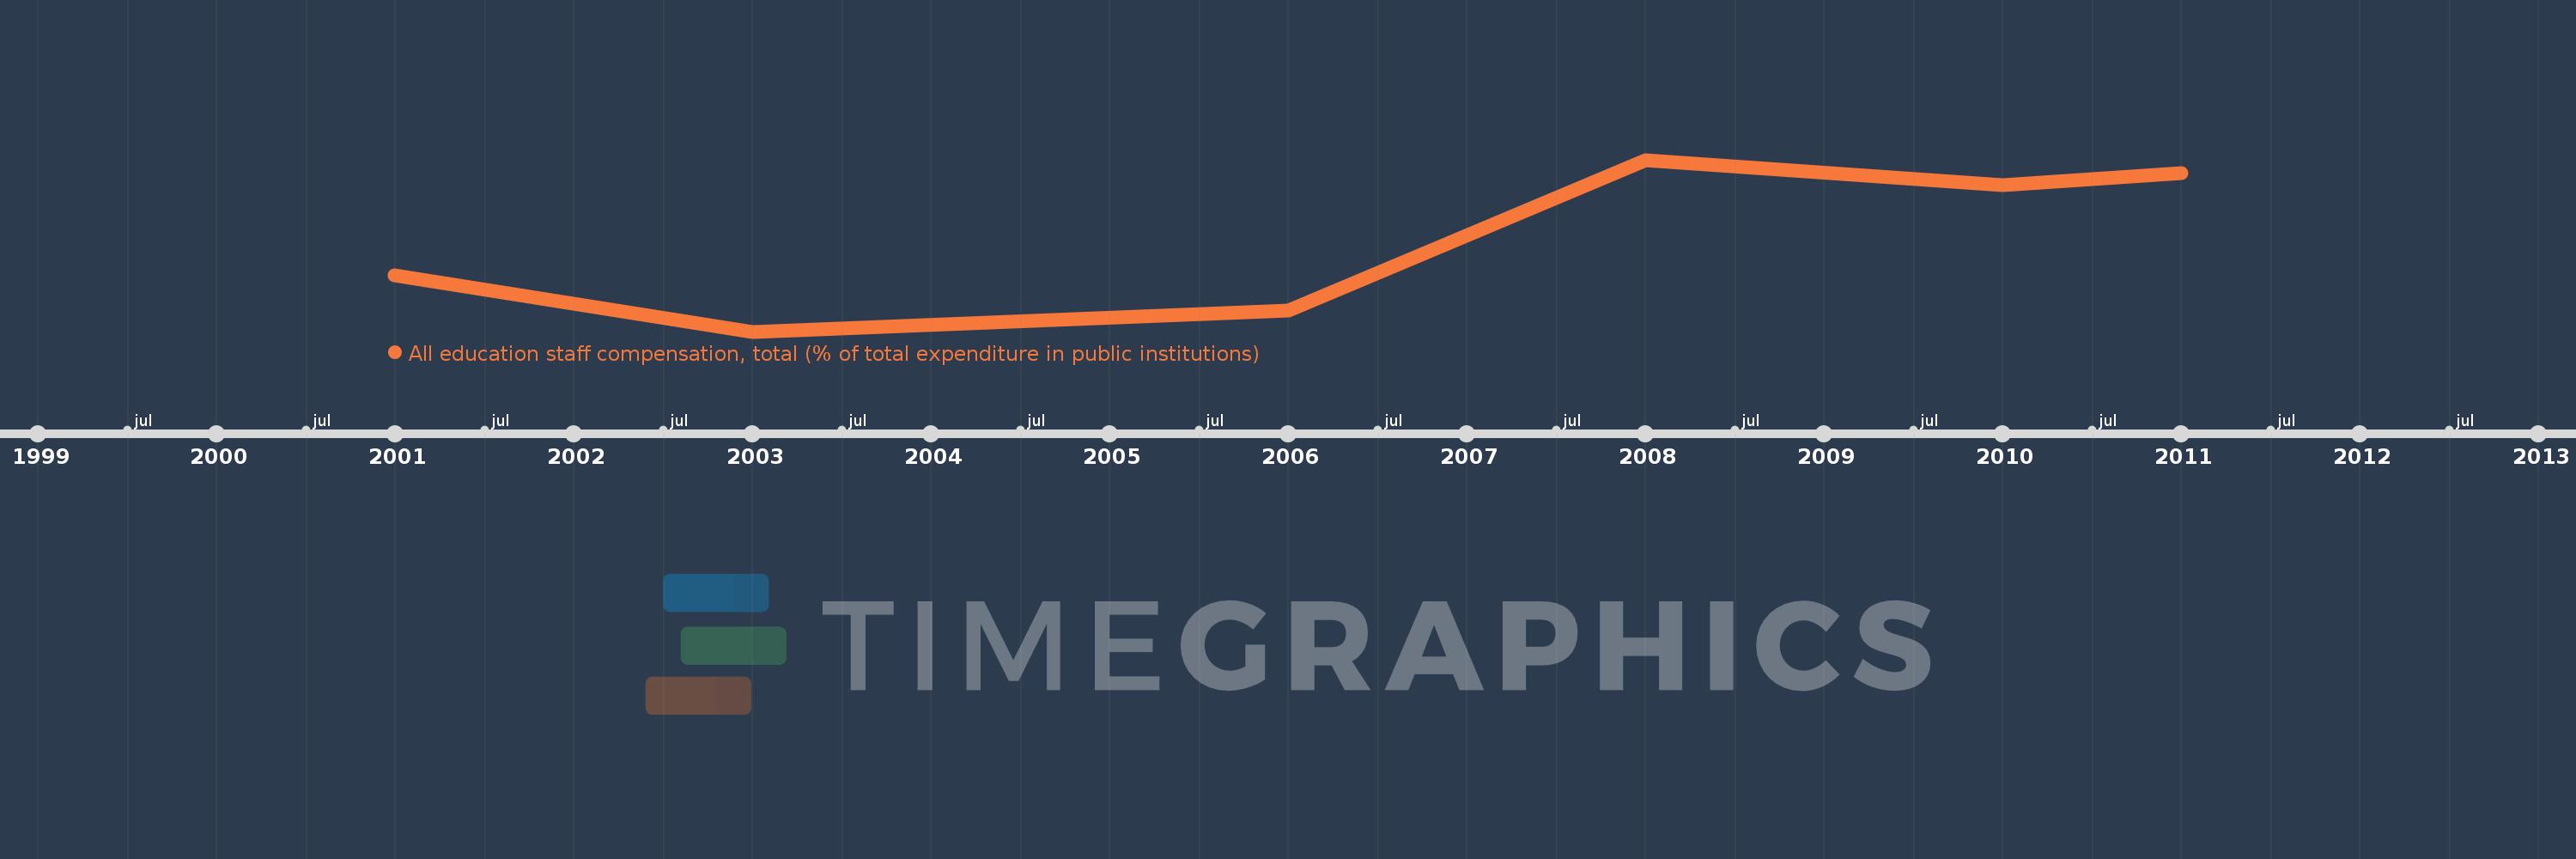
All education staff compensation, total (% of total expenditure in public institutions)
2011,2010,2008,2006,2003,2001
This statistics in other country:
Timeline:
This timeline shows a graph from 2001 to 2011 of St. Vincent and the Grenadines. No data until 2000. Number of actual observations by date: 6.
Source name:
World Development Indicators
Source organization:
United Nations Educational, Scientific, and Cultural Organization (UNESCO) Institute for Statistics.
Categories, topics:
Education
Last updated:
apr 23, 2017
Indicators value changes by year
Maximum:
98.557
jan 1, 2008
At the date of observation
Value
Absolute change
Change from previous value
jan 1, 2001
62.704
+62.704
0.0%
jan 1, 2003
45.39
-17.314
-27.61%
jan 1, 2006
51.858
+6.468
14.25%
jan 1, 2008
98.557
+46.699
90.05%
jan 1, 2010
90.667
-7.889
-8.0%
jan 1, 2011
94.417
+3.749
4.14%
Ranking of countries by current statistics by years


Comments: