29
/
en
AIzaSyAYiBZKx7MnpbEhh9jyipgxe19OcubqV5w
April 1, 2024
69465
Argentina
ARG
true
2
1
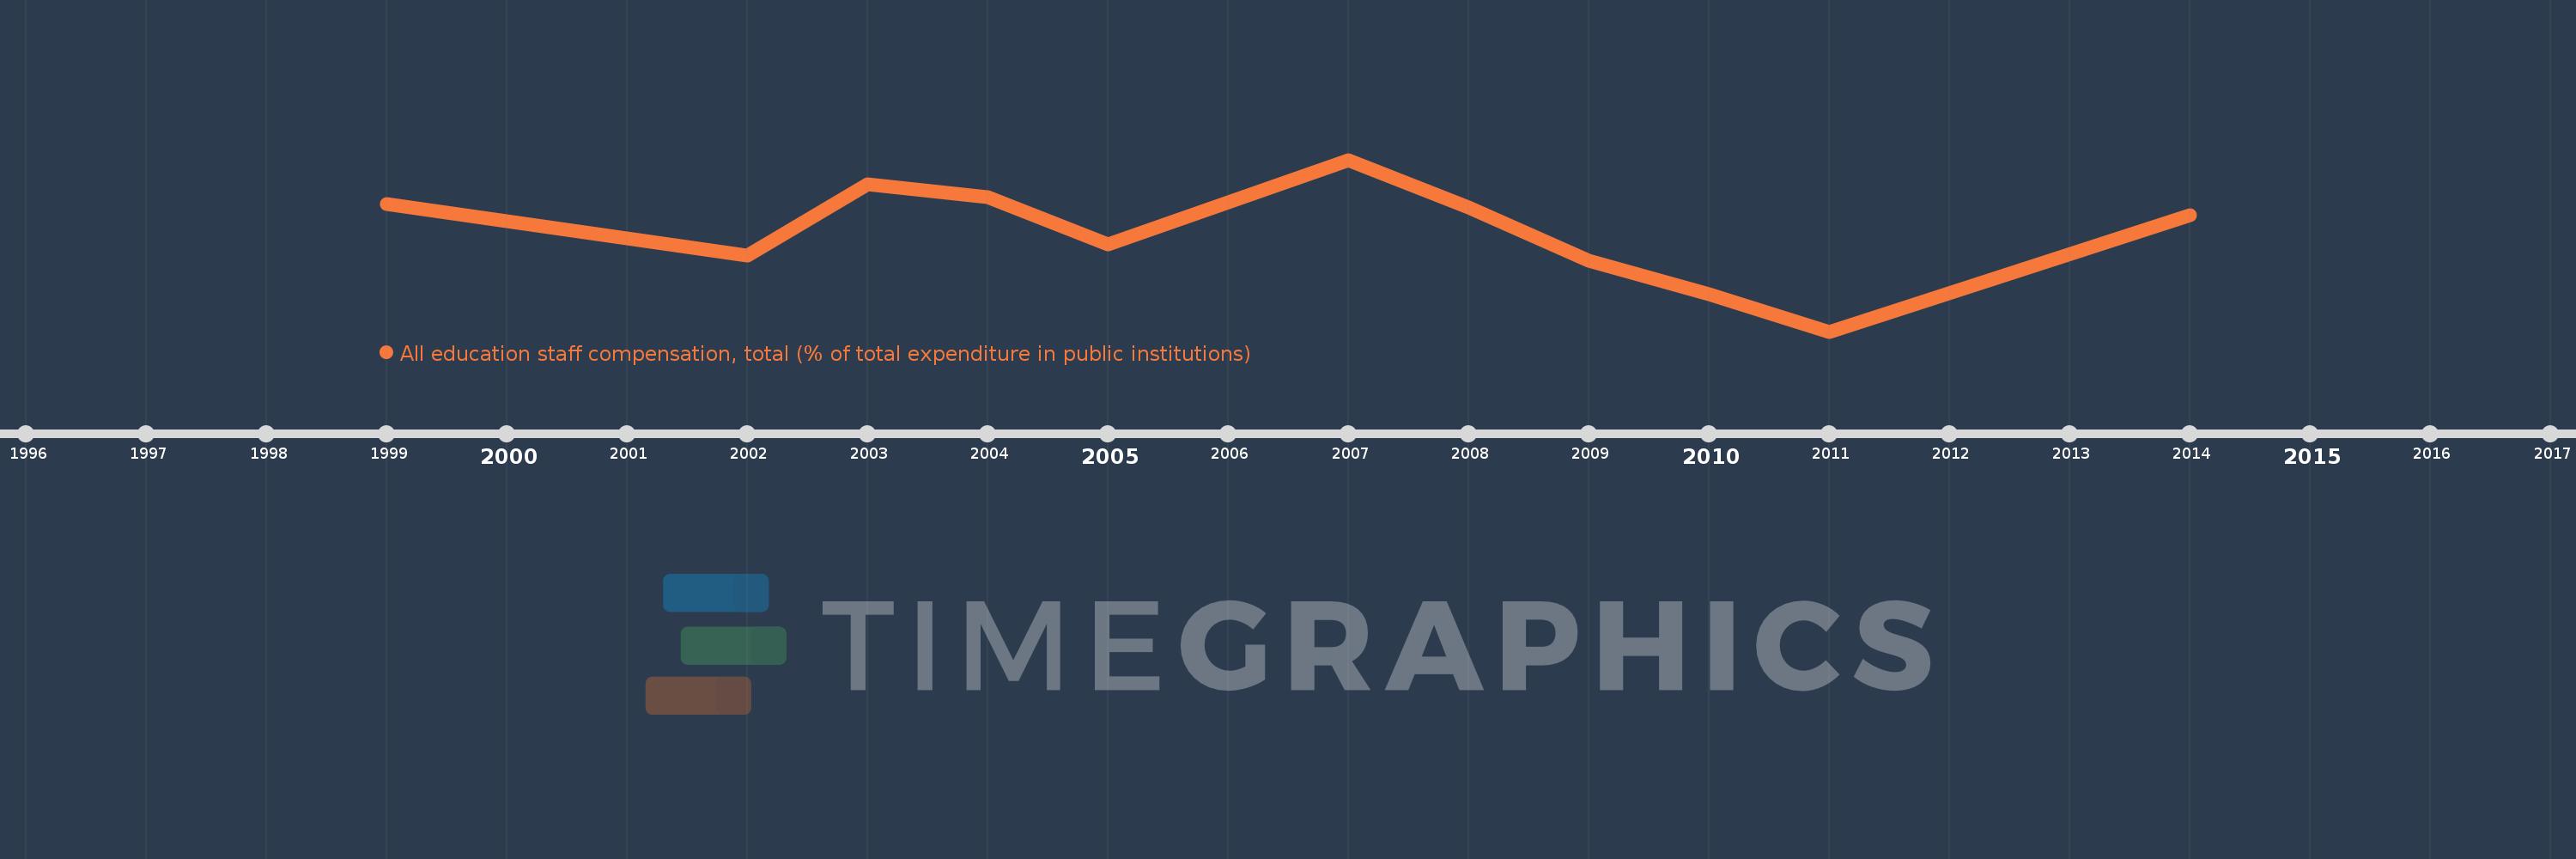
All education staff compensation, total (% of total expenditure in public institutions)
2014,2011,2010,2009,2008,2007,2005,2004,2003,2002,1999
This statistics in other country:
Timeline:
This timeline shows a graph from 1999 to 2014 of Argentina. No data until 1998. Number of actual observations by date: 11.
Source name:
World Development Indicators
Source organization:
United Nations Educational, Scientific, and Cultural Organization (UNESCO) Institute for Statistics.
Categories, topics:
Education
Last updated:
apr 23, 2017
Indicators value changes by year
Minimum:
85.872
jan 1, 2011
Maximum:
89.242
jan 1, 2007
At the date of observation
Value
Absolute change
Change from previous value
jan 1, 1999
88.378
+88.378
0.0%
jan 1, 2002
87.359
-1.019
-1.15%
jan 1, 2003
88.769
+1.41
1.61%
jan 1, 2004
88.505
-0.264
-0.3%
jan 1, 2005
87.577
-0.928
-1.05%
jan 1, 2007
89.242
+1.665
1.9%
jan 1, 2008
88.313
-0.929
-1.04%
jan 1, 2009
87.254
-1.059
-1.2%
jan 1, 2010
86.612
-0.641
-0.74%
jan 1, 2011
85.872
-0.741
-0.86%
jan 1, 2014
88.158
+2.286
2.66%
Ranking of countries by current statistics by years


Comments: