29
/
en
AIzaSyAYiBZKx7MnpbEhh9jyipgxe19OcubqV5w
April 1, 2024
100846
Canada
CAN
true
2
1
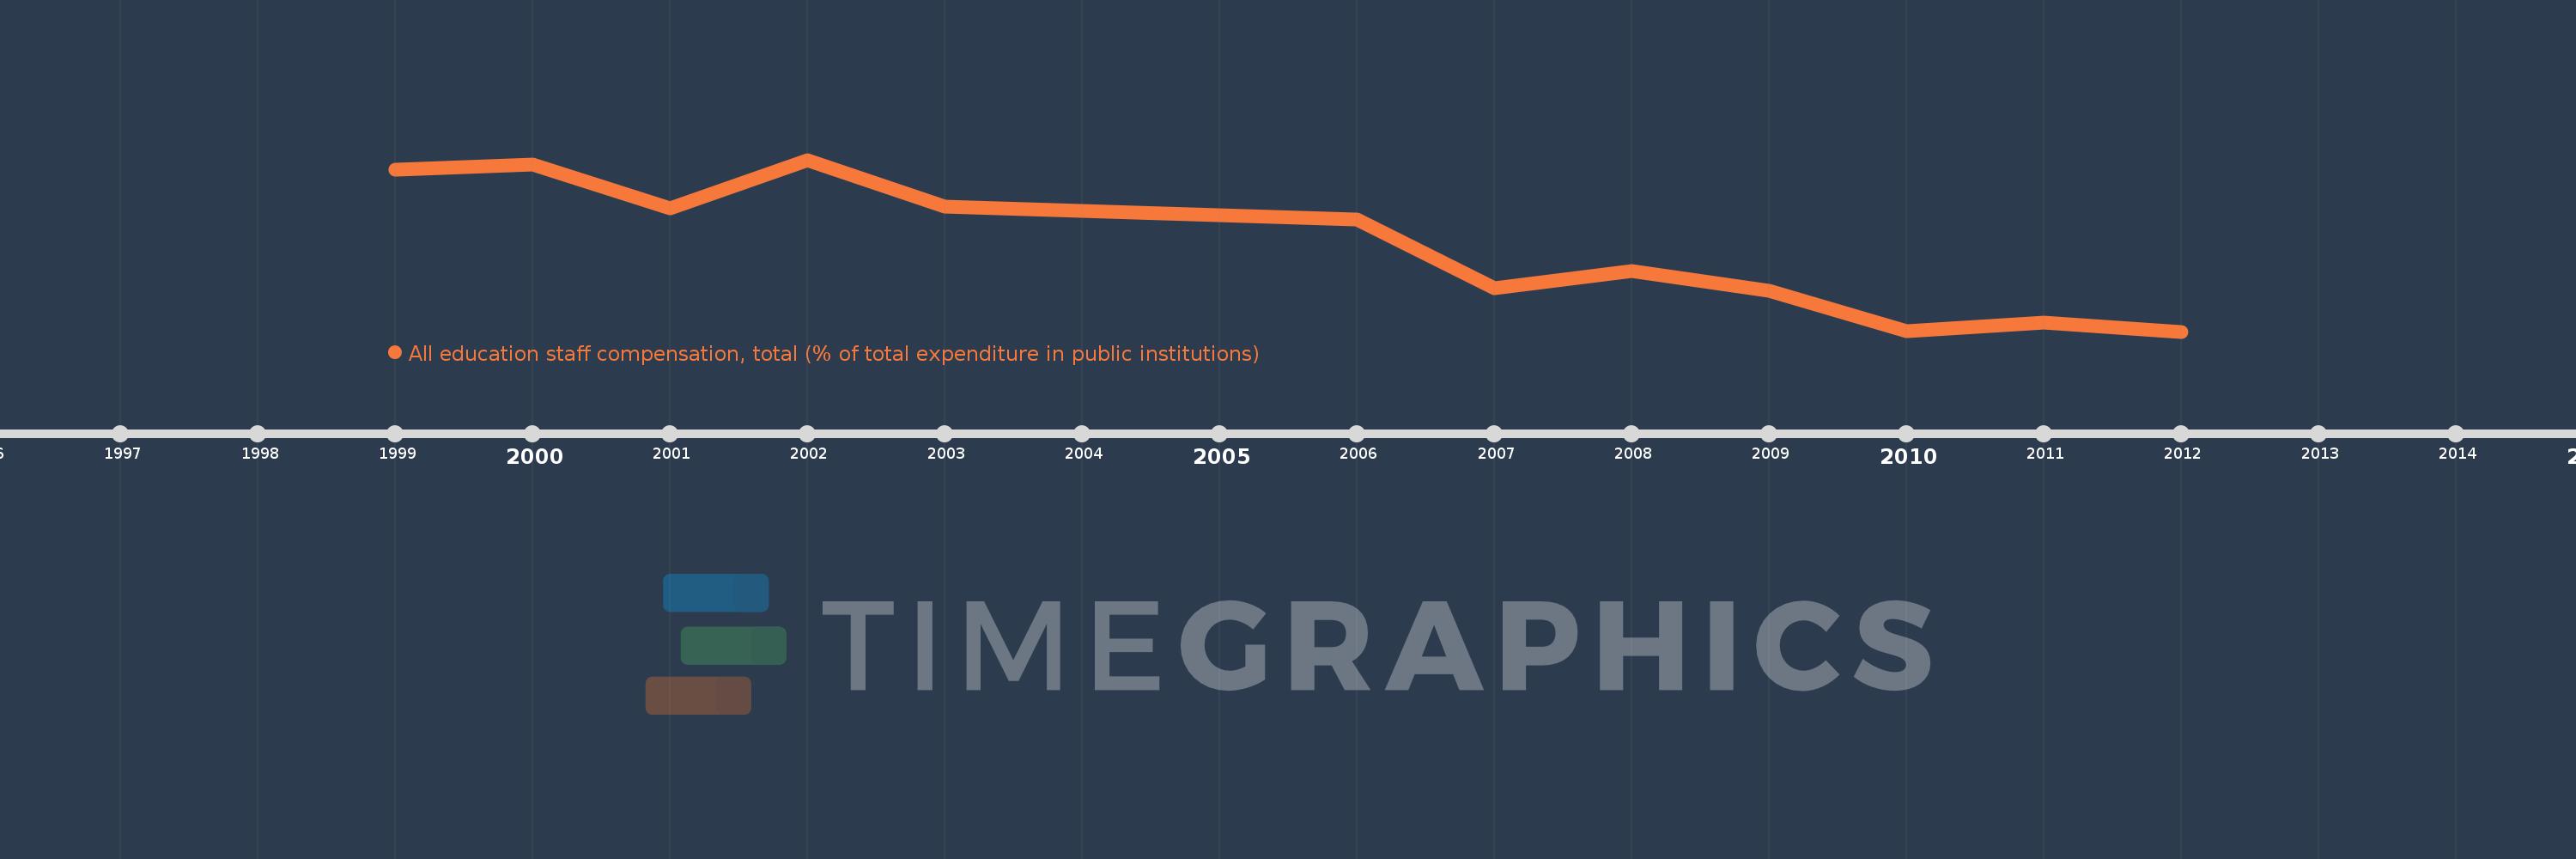
All education staff compensation, total (% of total expenditure in public institutions)
2012,2011,2010,2009,2008,2007,2006,2003,2002,2001,2000,1999
This statistics in other country:
Timeline:
This timeline shows a graph from 1999 to 2012 of Canada. No data until 1998. Number of actual observations by date: 12.
Source name:
World Development Indicators
Source organization:
United Nations Educational, Scientific, and Cultural Organization (UNESCO) Institute for Statistics.
Categories, topics:
Education
Last updated:
apr 23, 2017
Indicators value changes by year
Minimum:
65.456
jan 1, 2012
Maximum:
72.431
jan 1, 2002
At the date of observation
Value
Absolute change
Change from previous value
jan 1, 1999
72.038
+72.038
0.0%
jan 1, 2000
72.233
+0.195
0.27%
jan 1, 2001
70.452
-1.781
-2.47%
jan 1, 2002
72.431
+1.98
2.81%
jan 1, 2003
70.53
-1.901
-2.63%
jan 1, 2006
69.999
-0.531
-0.75%
jan 1, 2007
67.23
-2.769
-3.96%
jan 1, 2008
67.906
+0.676
1.01%
jan 1, 2009
67.13
-0.776
-1.14%
jan 1, 2010
65.489
-1.641
-2.44%
jan 1, 2011
65.836
+0.347
0.53%
jan 1, 2012
65.456
-0.38
-0.58%
Ranking of countries by current statistics by years


Comments: