29
/
en
AIzaSyAYiBZKx7MnpbEhh9jyipgxe19OcubqV5w
April 1, 2024
220451
Paraguay
PRY
true
2
1
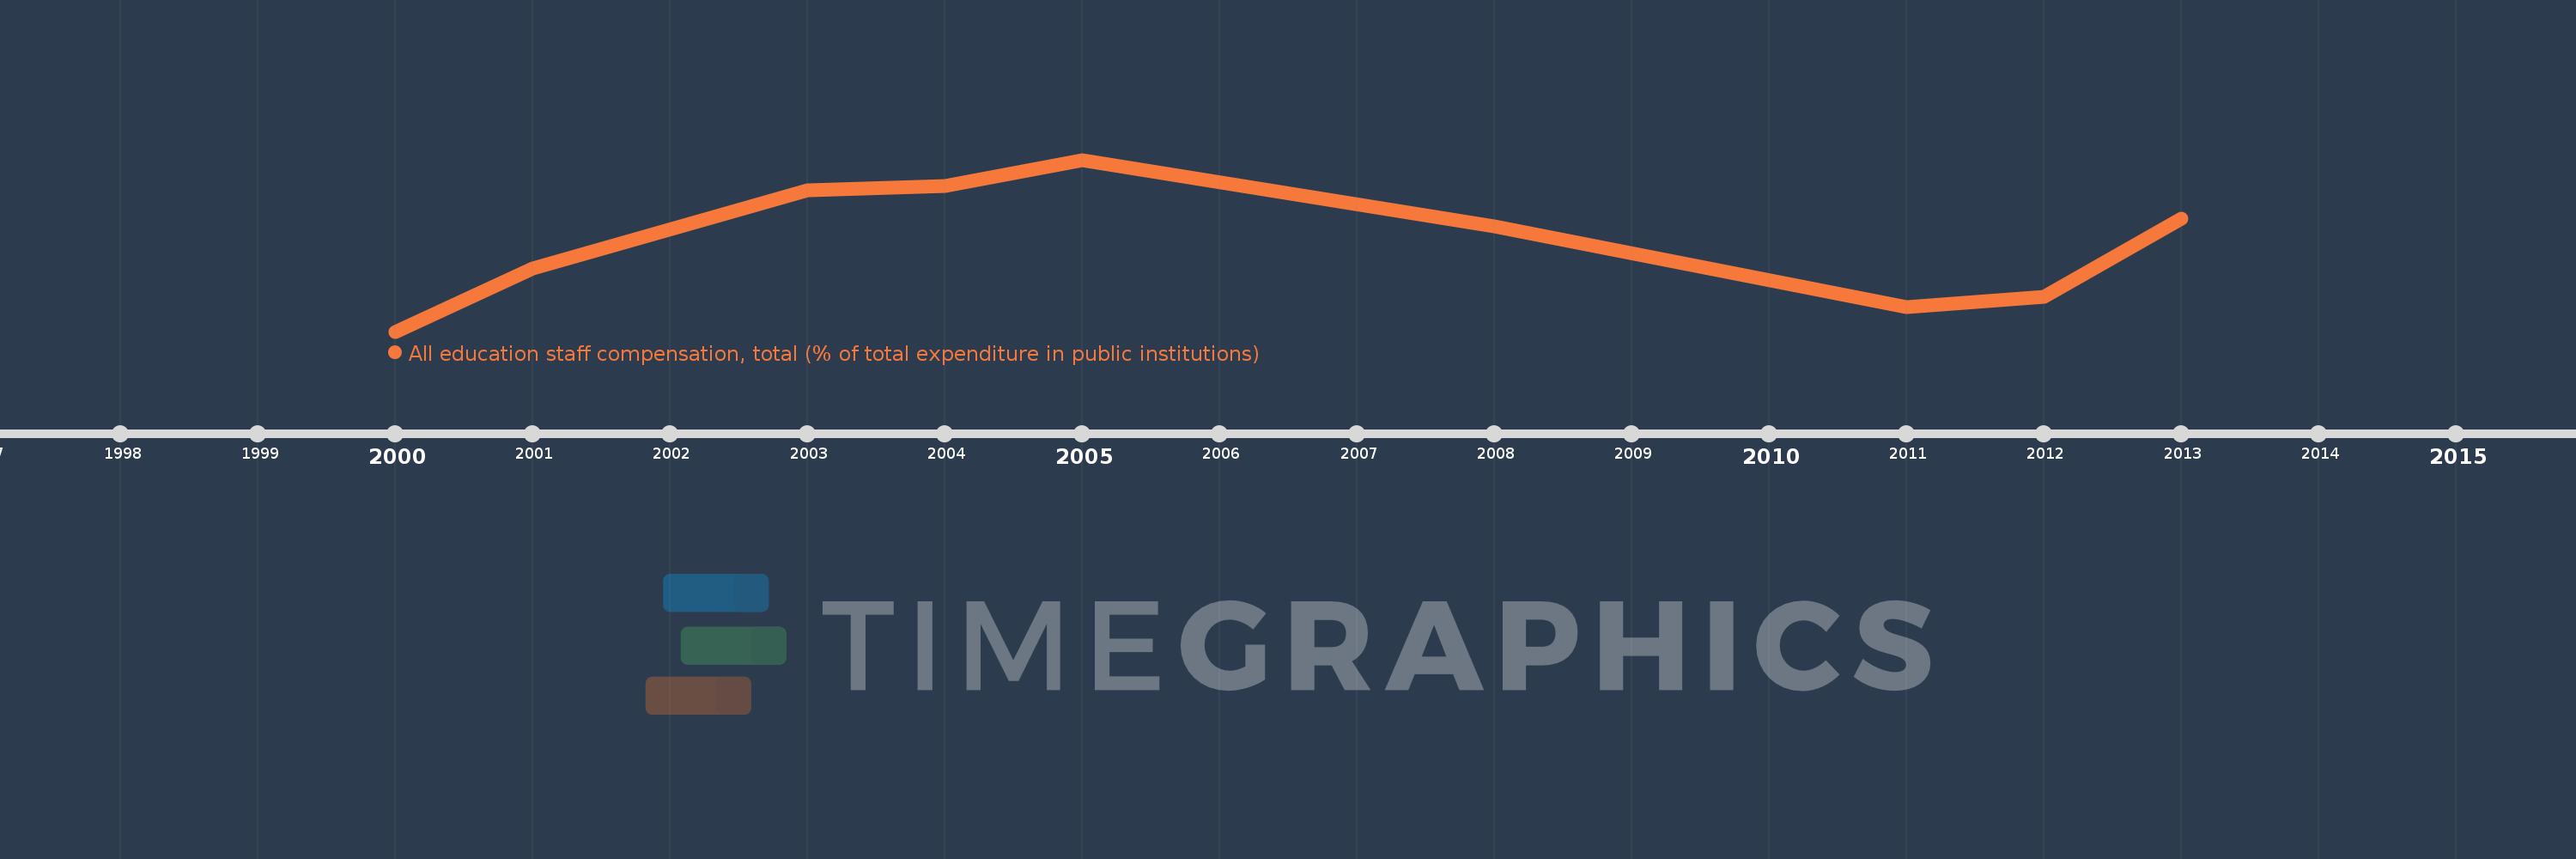
All education staff compensation, total (% of total expenditure in public institutions)
2013,2012,2011,2008,2005,2004,2003,2001,2000
This statistics in other country:
Timeline:
This timeline shows a graph from 2000 to 2013 of Paraguay. No data until 1999. Number of actual observations by date: 9.
Source name:
World Development Indicators
Source organization:
United Nations Educational, Scientific, and Cultural Organization (UNESCO) Institute for Statistics.
Categories, topics:
Education
Last updated:
apr 23, 2017
Indicators value changes by year
Minimum:
61.517
jan 1, 2000
Maximum:
89.414
jan 1, 2005
At the date of observation
Value
Absolute change
Change from previous value
jan 1, 2000
61.517
+61.517
0.0%
jan 1, 2001
71.821
+10.304
16.75%
jan 1, 2003
84.488
+12.667
17.64%
jan 1, 2004
85.118
+0.63
0.75%
jan 1, 2005
89.414
+4.296
5.05%
jan 1, 2008
78.651
-10.763
-12.04%
jan 1, 2011
65.527
-13.124
-16.69%
jan 1, 2012
67.129
+1.602
2.44%
jan 1, 2013
79.882
+12.754
19.0%
Ranking of countries by current statistics by years


Comments: