29
/
en
AIzaSyAYiBZKx7MnpbEhh9jyipgxe19OcubqV5w
April 1, 2024
74607
Azerbaijan
AZE
true
2
1
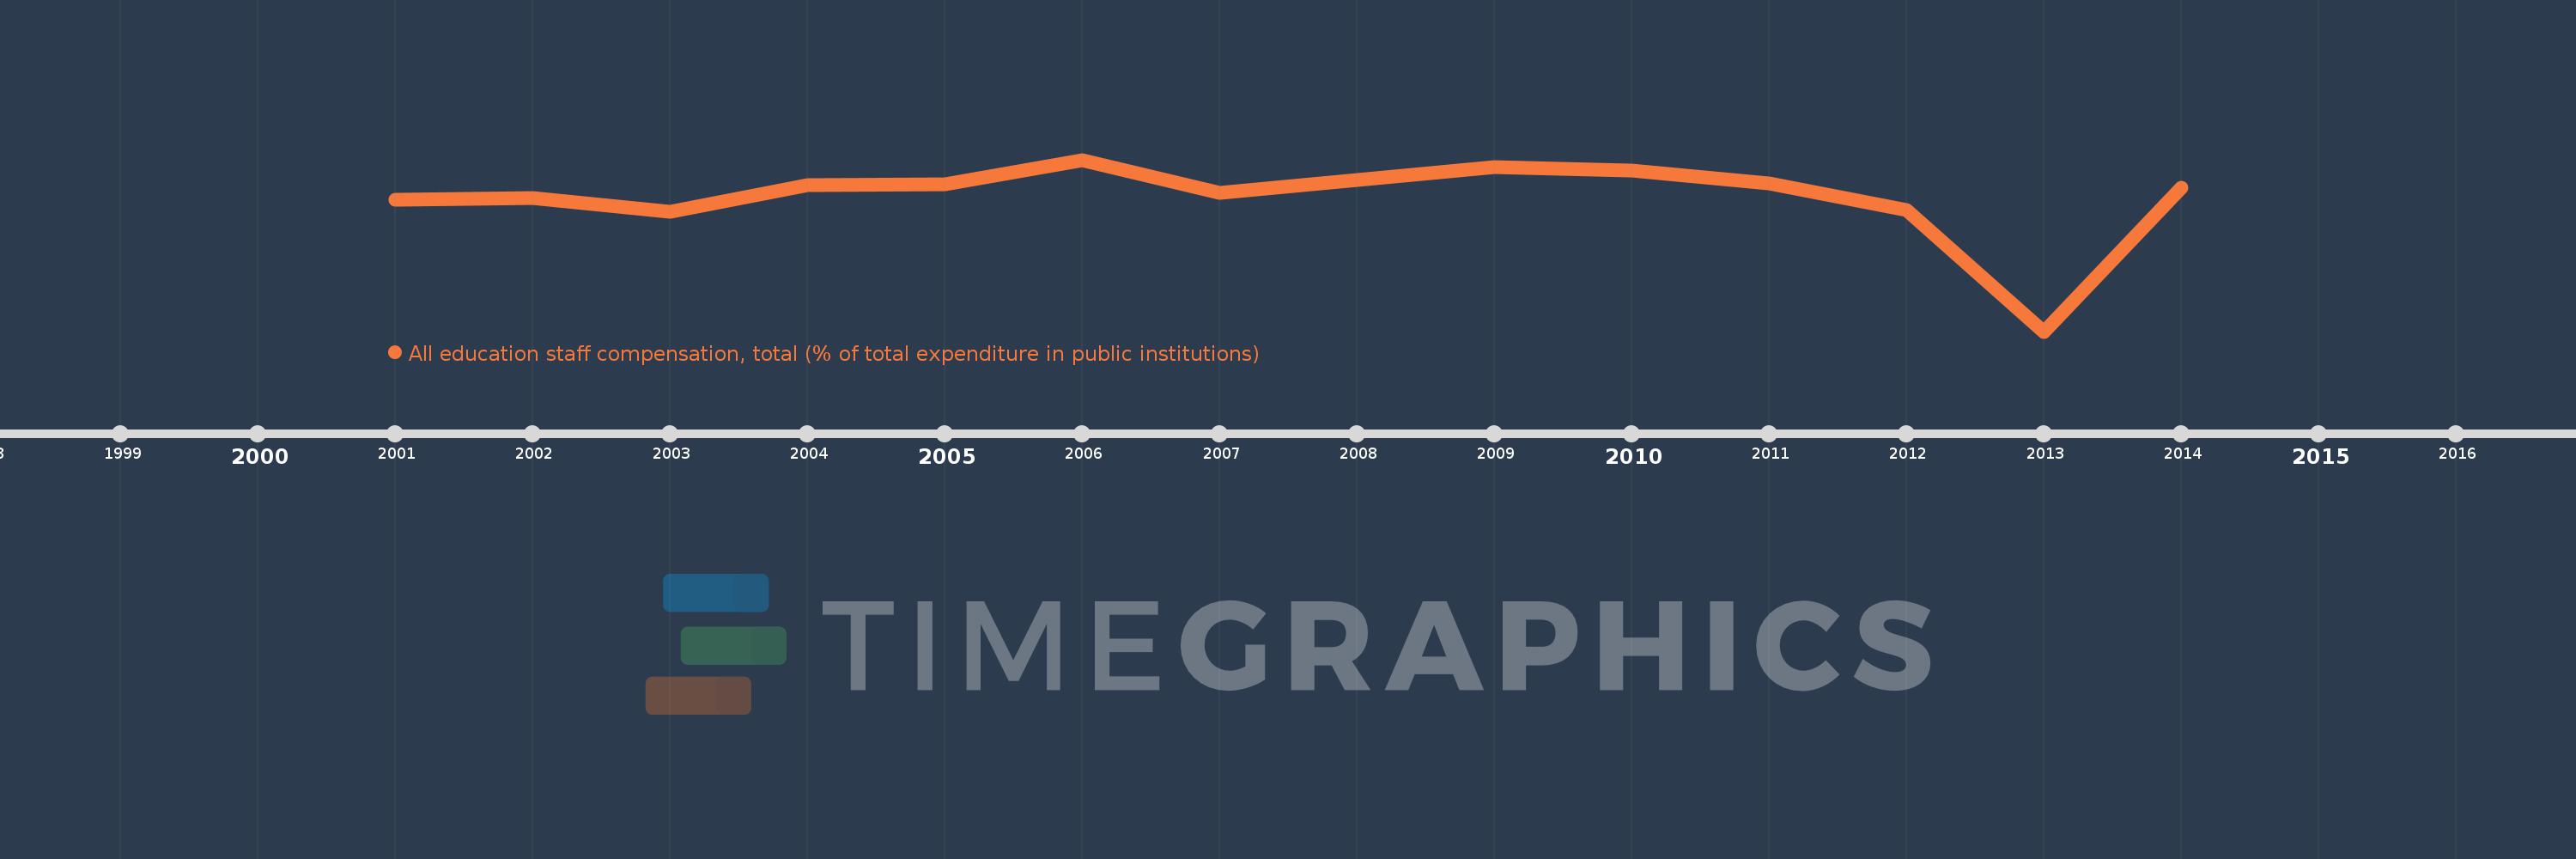
All education staff compensation, total (% of total expenditure in public institutions)
2014,2013,2012,2011,2010,2009,2008,2007,2006,2005,2004,2003,2002,2001
This statistics in other country:
Timeline:
This timeline shows a graph from 2001 to 2014 of Azerbaijan. No data until 2000. Number of actual observations by date: 14.
Source name:
World Development Indicators
Source organization:
United Nations Educational, Scientific, and Cultural Organization (UNESCO) Institute for Statistics.
Categories, topics:
Education
Last updated:
apr 23, 2017
Indicators value changes by year
Minimum:
52.845
jan 1, 2013
Maximum:
66.791
jan 1, 2006
At the date of observation
Value
Absolute change
Change from previous value
jan 1, 2001
63.581
+63.581
0.0%
jan 1, 2002
63.656
+0.075
0.12%
jan 1, 2003
62.592
-1.064
-1.67%
jan 1, 2004
64.709
+2.117
3.38%
jan 1, 2005
64.825
+0.116
0.18%
jan 1, 2006
66.791
+1.966
3.03%
jan 1, 2007
64.126
-2.665
-3.99%
jan 1, 2008
65.139
+1.013
1.58%
jan 1, 2009
66.211
+1.072
1.65%
jan 1, 2010
65.904
-0.308
-0.46%
jan 1, 2011
64.847
-1.056
-1.6%
jan 1, 2012
62.68
-2.167
-3.34%
jan 1, 2013
52.845
-9.834
-15.69%
jan 1, 2014
64.52
+11.674
22.09%
Ranking of countries by current statistics by years


Comments: