29
/
en
AIzaSyAYiBZKx7MnpbEhh9jyipgxe19OcubqV5w
April 1, 2024
51669
North America
NAC
false
2
1
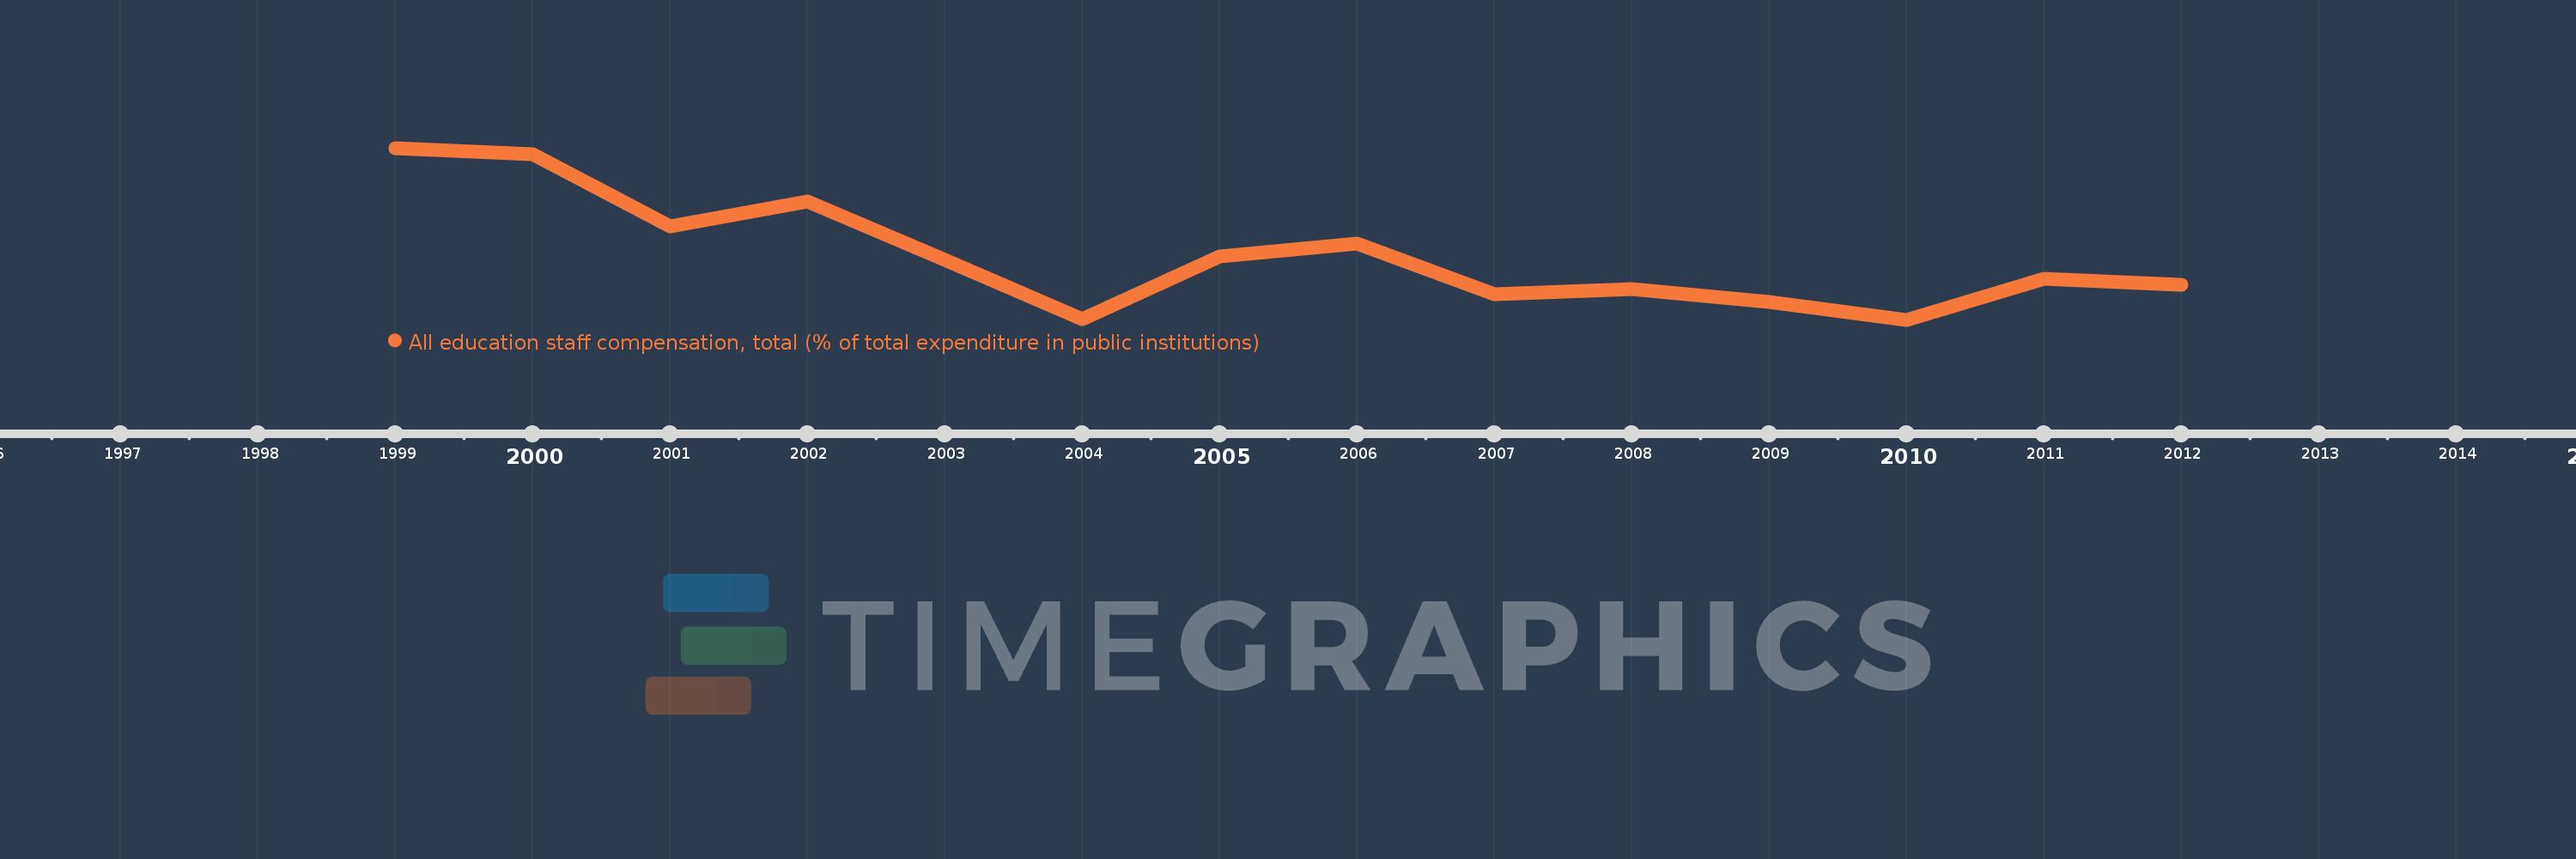
All education staff compensation, total (% of total expenditure in public institutions)
2012,2011,2010,2009,2008,2007,2006,2005,2004,2003,2002,2001,2000,1999
This statistics in other country:
Timeline:
This timeline shows a graph from 1999 to 2012 of North America. No data until 1998. Number of actual observations by date: 14.
Source name:
World Development Indicators
Source organization:
United Nations Educational, Scientific, and Cultural Organization (UNESCO) Institute for Statistics.
Categories, topics:
Education
Last updated:
apr 23, 2017
Indicators value changes by year
Minimum:
66.217
jan 1, 2010
At the date of observation
Value
Absolute change
Change from previous value
jan 1, 1999
72.09
+72.09
0.0%
jan 1, 2000
71.874
-0.216
-0.3%
jan 1, 2001
69.401
-2.473
-3.44%
jan 1, 2002
70.274
+0.872
1.26%
jan 1, 2003
68.257
-2.017
-2.87%
jan 1, 2004
66.237
-2.02
-2.96%
jan 1, 2005
68.395
+2.158
3.26%
jan 1, 2006
68.824
+0.429
0.63%
jan 1, 2007
67.091
-1.733
-2.52%
jan 1, 2008
67.279
+0.188
0.28%
jan 1, 2009
66.836
-0.443
-0.66%
jan 1, 2010
66.217
-0.619
-0.93%
jan 1, 2011
67.62
+1.403
2.12%
jan 1, 2012
67.424
-0.197
-0.29%
Ranking of countries by current statistics by years


Comments: