29
/
en
AIzaSyAYiBZKx7MnpbEhh9jyipgxe19OcubqV5w
April 1, 2024
81491
Belgium
BEL
true
2
1
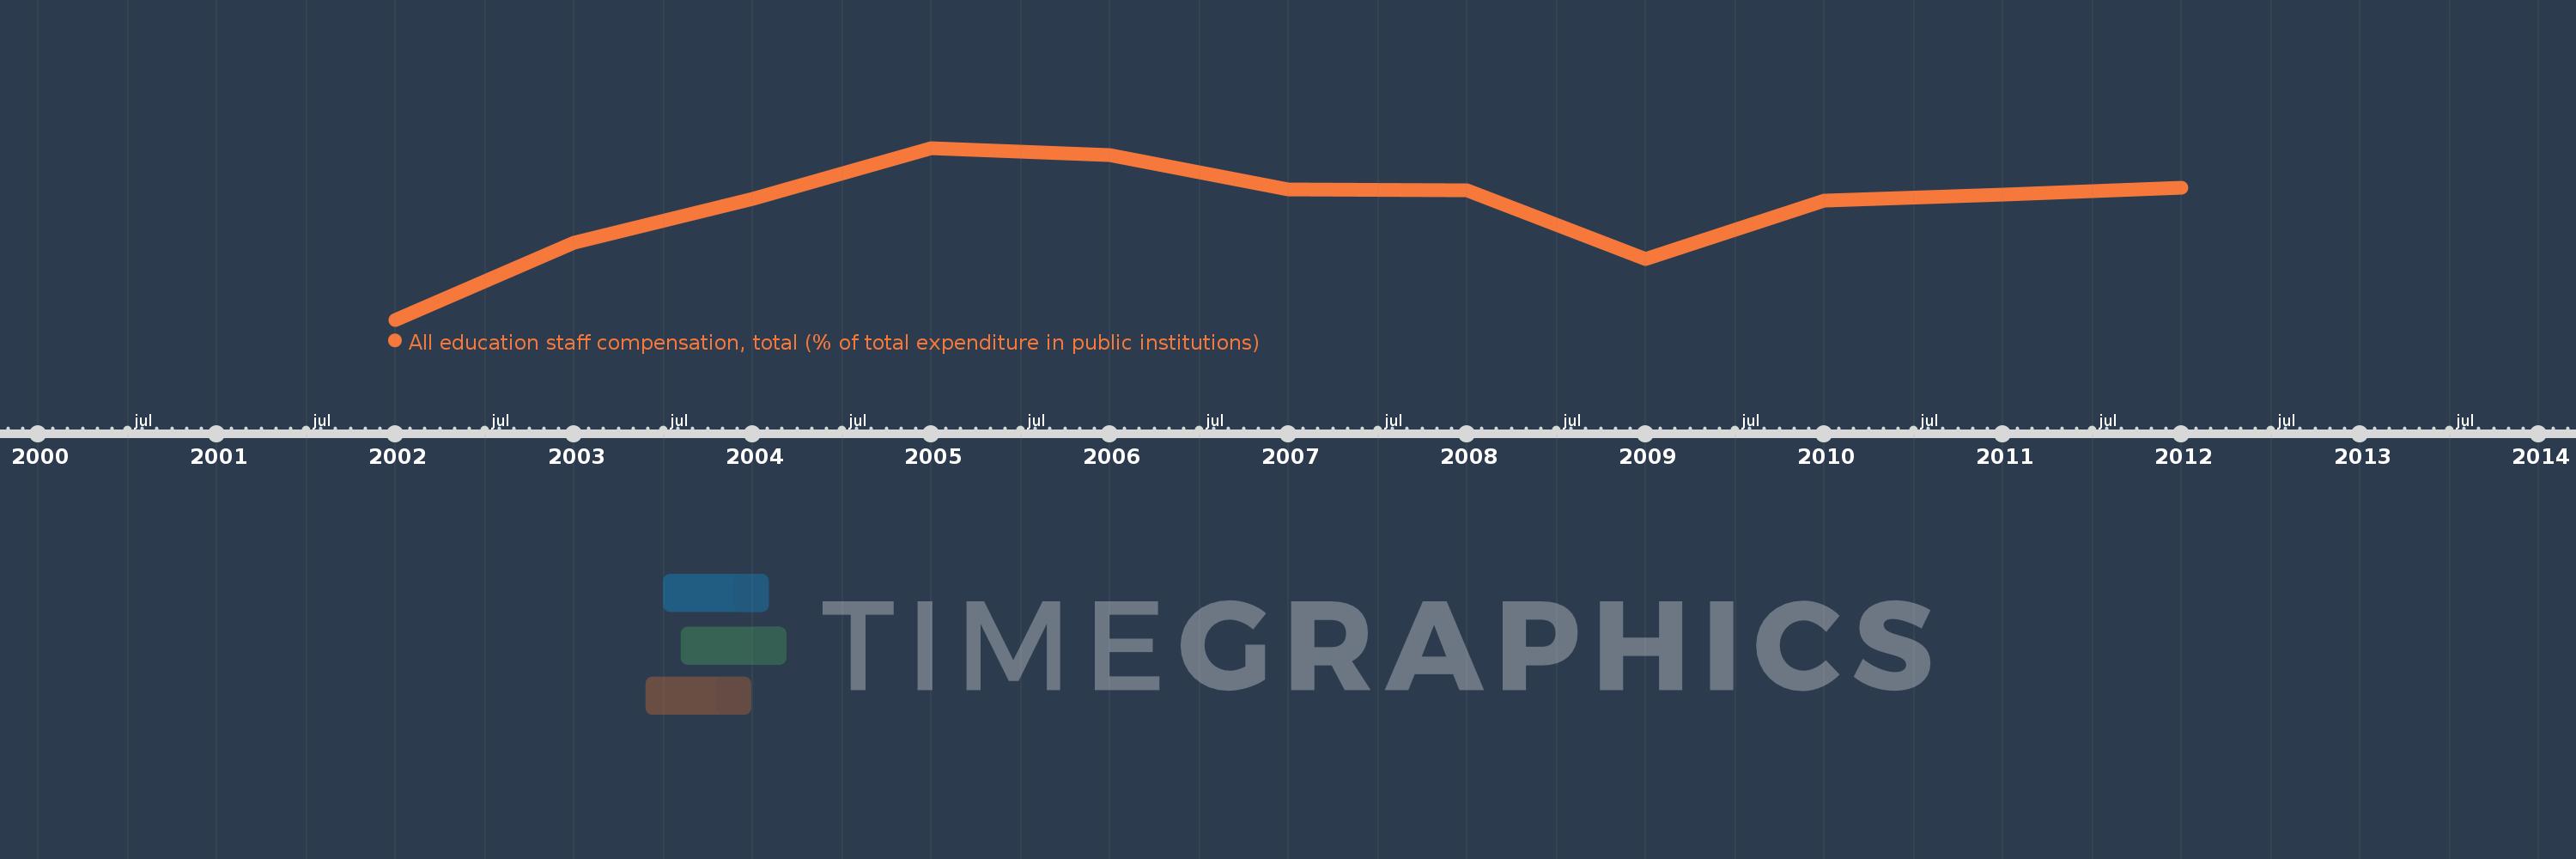
All education staff compensation, total (% of total expenditure in public institutions)
2012,2011,2010,2009,2008,2007,2006,2005,2004,2003,2002
This statistics in other country:
Timeline:
This timeline shows a graph from 2002 to 2012 of Belgium. No data until 2001. Number of actual observations by date: 11.
Source name:
World Development Indicators
Source organization:
United Nations Educational, Scientific, and Cultural Organization (UNESCO) Institute for Statistics.
Categories, topics:
Education
Last updated:
apr 23, 2017
Indicators value changes by year
Minimum:
80.496
jan 1, 2002
Maximum:
85.696
jan 1, 2005
At the date of observation
Value
Absolute change
Change from previous value
jan 1, 2002
80.496
+80.496
0.0%
jan 1, 2003
82.834
+2.338
2.9%
jan 1, 2004
84.161
+1.326
1.6%
jan 1, 2005
85.696
+1.535
1.82%
jan 1, 2006
85.487
-0.209
-0.24%
jan 1, 2007
84.445
-1.042
-1.22%
jan 1, 2008
84.419
-0.027
-0.03%
jan 1, 2009
82.327
-2.092
-2.48%
jan 1, 2010
84.097
+1.77
2.15%
jan 1, 2011
84.284
+0.186
0.22%
jan 1, 2012
84.484
+0.2
0.24%
Ranking of countries by current statistics by years


Comments: