29
/
en
AIzaSyAYiBZKx7MnpbEhh9jyipgxe19OcubqV5w
April 1, 2024
197148
Moldova
MDA
true
2
1
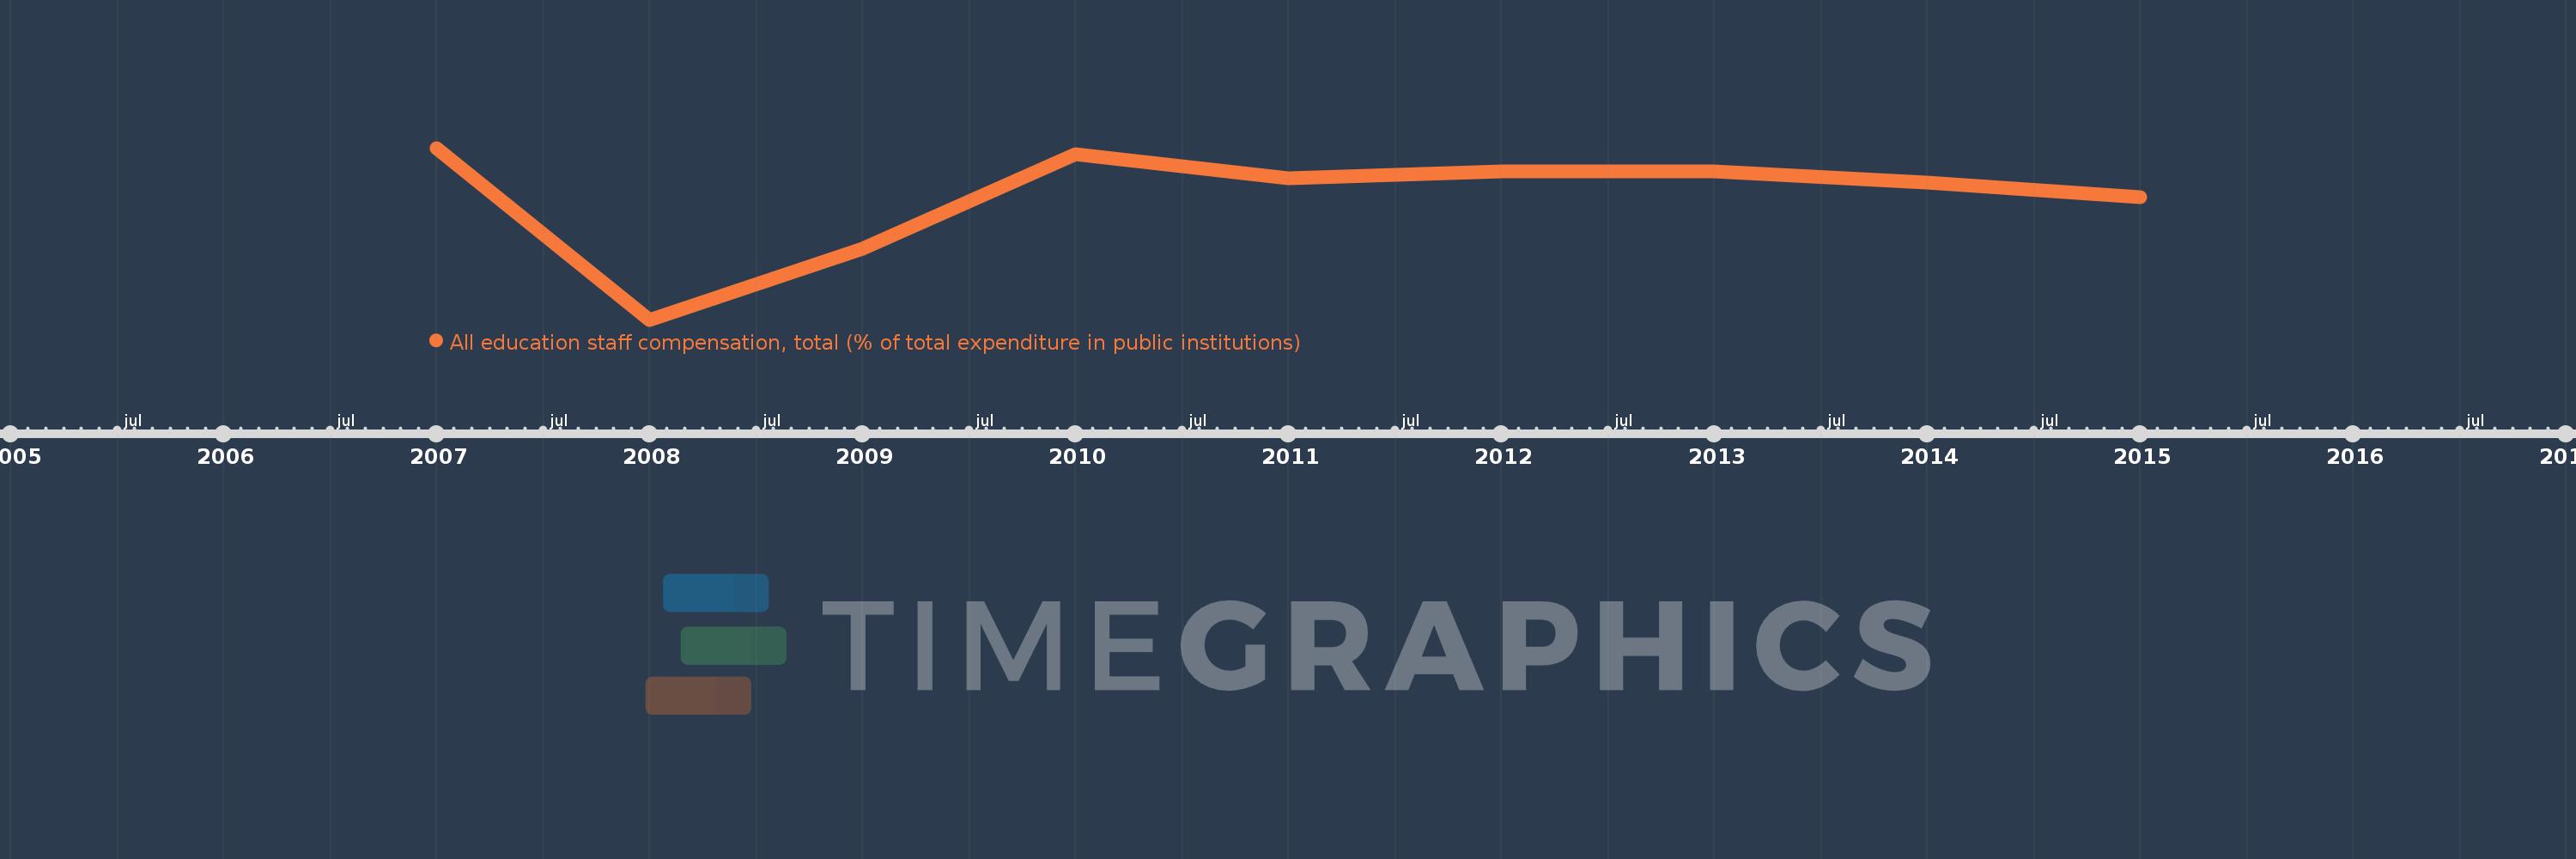
All education staff compensation, total (% of total expenditure in public institutions)
2015,2014,2013,2012,2011,2010,2009,2008,2007
This statistics in other country:
Timeline:
This timeline shows a graph from 2007 to 2015 of Moldova. No data until 2006. Number of actual observations by date: 9.
Source name:
World Development Indicators
Source organization:
United Nations Educational, Scientific, and Cultural Organization (UNESCO) Institute for Statistics.
Categories, topics:
Education
Last updated:
apr 23, 2017
Indicators value changes by year
Minimum:
48.542
jan 1, 2008
Maximum:
65.651
jan 1, 2007
At the date of observation
Value
Absolute change
Change from previous value
jan 1, 2007
65.651
+65.651
0.0%
jan 1, 2008
48.542
-17.109
-26.06%
jan 1, 2009
55.609
+7.067
14.56%
jan 1, 2010
65.021
+9.412
16.93%
jan 1, 2011
62.647
-2.374
-3.65%
jan 1, 2012
63.311
+0.664
1.06%
jan 1, 2013
63.28
-0.031
-0.05%
jan 1, 2014
62.197
-1.083
-1.71%
jan 1, 2015
60.777
-1.421
-2.28%
Ranking of countries by current statistics by years


Comments: