29
/
en
AIzaSyAYiBZKx7MnpbEhh9jyipgxe19OcubqV5w
April 1, 2024
35540
High income
HIC
false
2
1
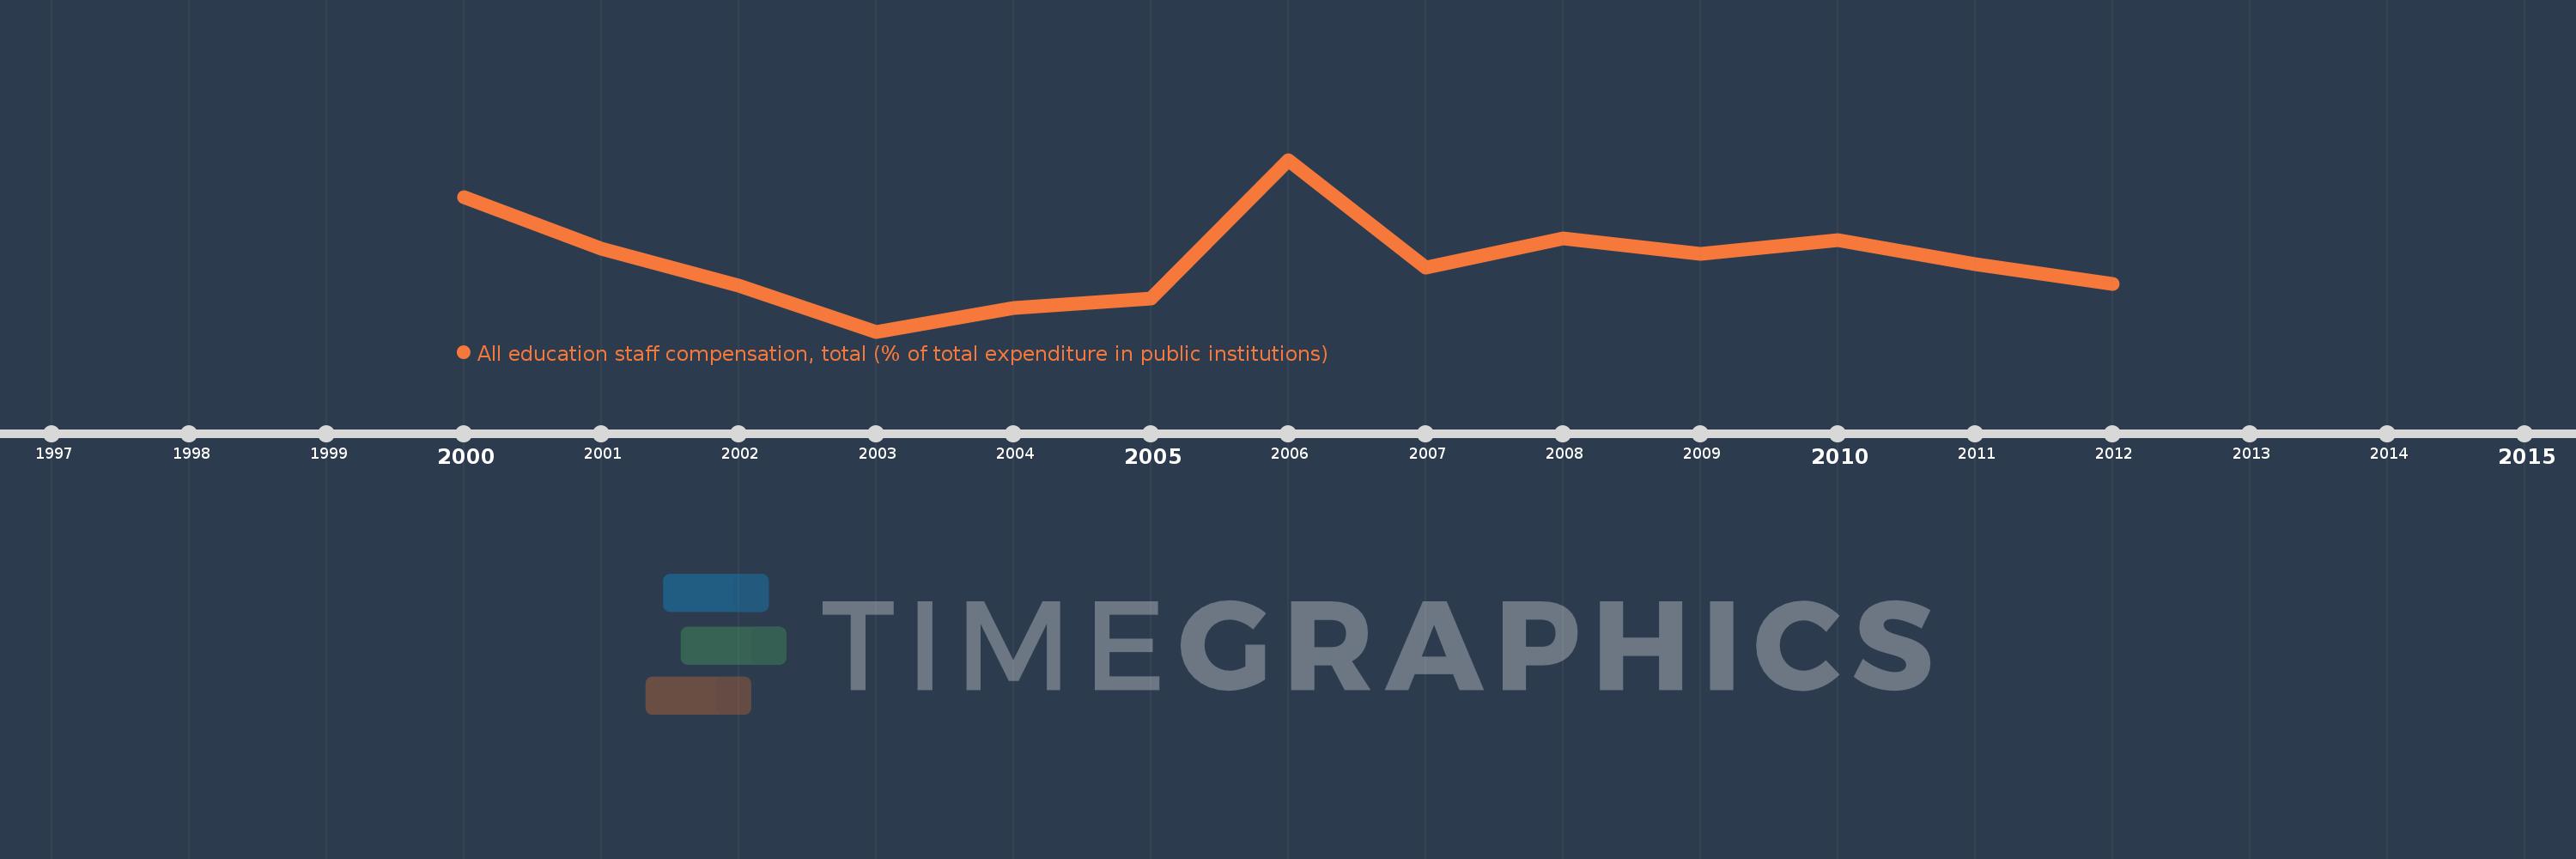
All education staff compensation, total (% of total expenditure in public institutions)
2012,2011,2010,2009,2008,2007,2006,2005,2004,2003,2002,2001,2000
This statistics in other country:
Timeline:
This timeline shows a graph from 2000 to 2012 of High income. No data until 1999. Number of actual observations by date: 13.
Source name:
World Development Indicators
Source organization:
United Nations Educational, Scientific, and Cultural Organization (UNESCO) Institute for Statistics.
Categories, topics:
Education
Last updated:
apr 23, 2017
Indicators value changes by year
Minimum:
69.011
jan 1, 2003
Maximum:
71.769
jan 1, 2006
At the date of observation
Value
Absolute change
Change from previous value
jan 1, 2000
71.167
+71.167
0.0%
jan 1, 2001
70.345
-0.822
-1.15%
jan 1, 2002
69.753
-0.593
-0.84%
jan 1, 2003
69.011
-0.742
-1.06%
jan 1, 2004
69.391
+0.38
0.55%
jan 1, 2005
69.544
+0.153
0.22%
jan 1, 2006
71.769
+2.225
3.2%
jan 1, 2007
70.042
-1.727
-2.41%
jan 1, 2008
70.505
+0.463
0.66%
jan 1, 2009
70.264
-0.241
-0.34%
jan 1, 2010
70.473
+0.21
0.3%
jan 1, 2011
70.09
-0.383
-0.54%
jan 1, 2012
69.78
-0.31
-0.44%
Ranking of countries by current statistics by years


Comments: