29
/
en
AIzaSyAYiBZKx7MnpbEhh9jyipgxe19OcubqV5w
April 1, 2024
214044
Norway
NOR
true
2
1
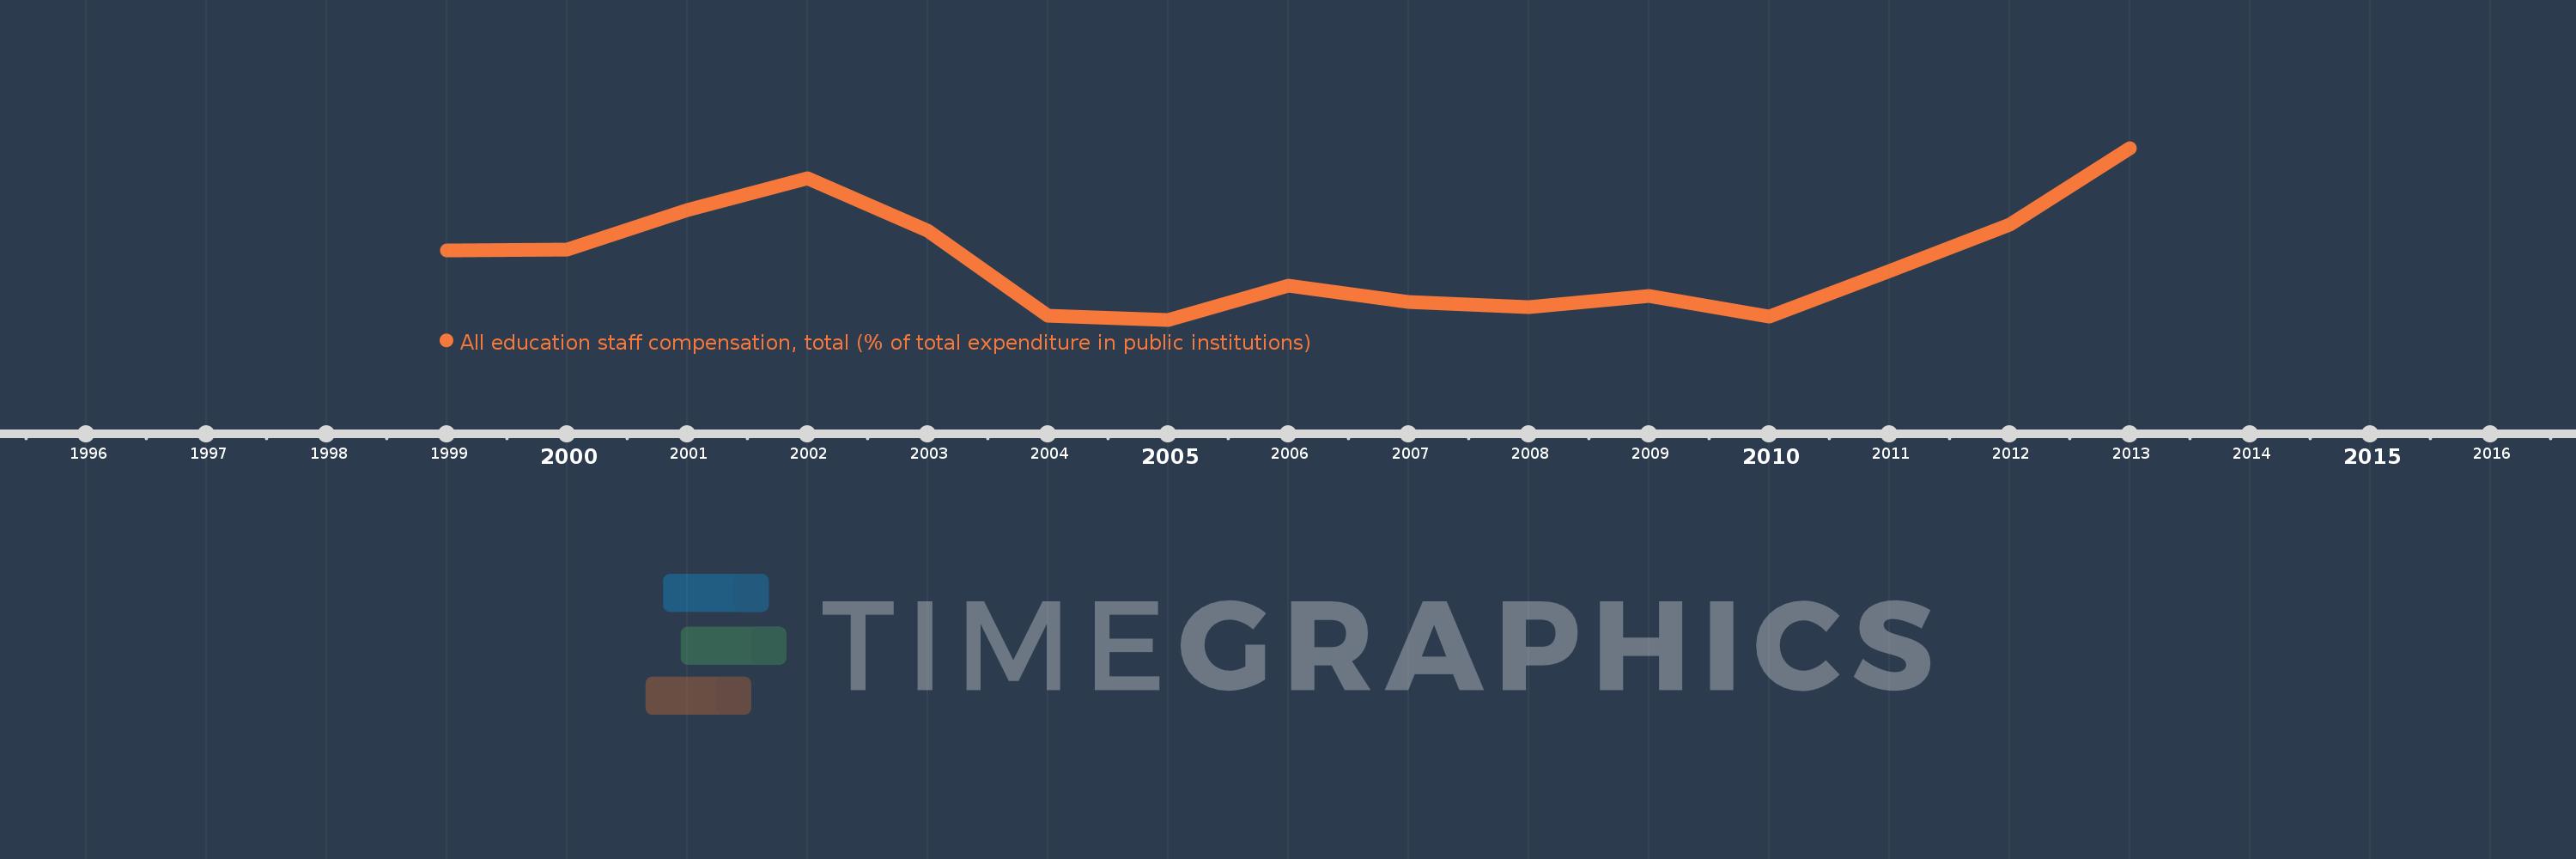
All education staff compensation, total (% of total expenditure in public institutions)
2013,2012,2011,2010,2009,2008,2007,2006,2005,2004,2003,2002,2001,2000,1999
This statistics in other country:
Timeline:
This timeline shows a graph from 1999 to 2013 of Norway. No data until 1998. Number of actual observations by date: 15.
Source name:
World Development Indicators
Source organization:
United Nations Educational, Scientific, and Cultural Organization (UNESCO) Institute for Statistics.
Categories, topics:
Education
Last updated:
apr 23, 2017
Indicators value changes by year
Minimum:
65.785
jan 1, 2005
Maximum:
71.581
jan 1, 2013
At the date of observation
Value
Absolute change
Change from previous value
jan 1, 1999
68.135
+68.135
0.0%
jan 1, 2000
68.156
+0.021
0.03%
jan 1, 2001
69.484
+1.327
1.95%
jan 1, 2002
70.548
+1.065
1.53%
jan 1, 2003
68.791
-1.758
-2.49%
jan 1, 2004
65.925
-2.866
-4.17%
jan 1, 2005
65.785
-0.139
-0.21%
jan 1, 2006
66.943
+1.157
1.76%
jan 1, 2007
66.391
-0.552
-0.82%
jan 1, 2008
66.21
-0.181
-0.27%
jan 1, 2009
66.601
+0.391
0.59%
jan 1, 2010
65.893
-0.708
-1.06%
jan 1, 2011
67.424
+1.532
2.32%
jan 1, 2012
68.985
+1.561
2.32%
jan 1, 2013
71.581
+2.595
3.76%
Ranking of countries by current statistics by years


Comments: