29
/
en
AIzaSyAYiBZKx7MnpbEhh9jyipgxe19OcubqV5w
April 1, 2024
89740
Botswana
BWA
true
2
1
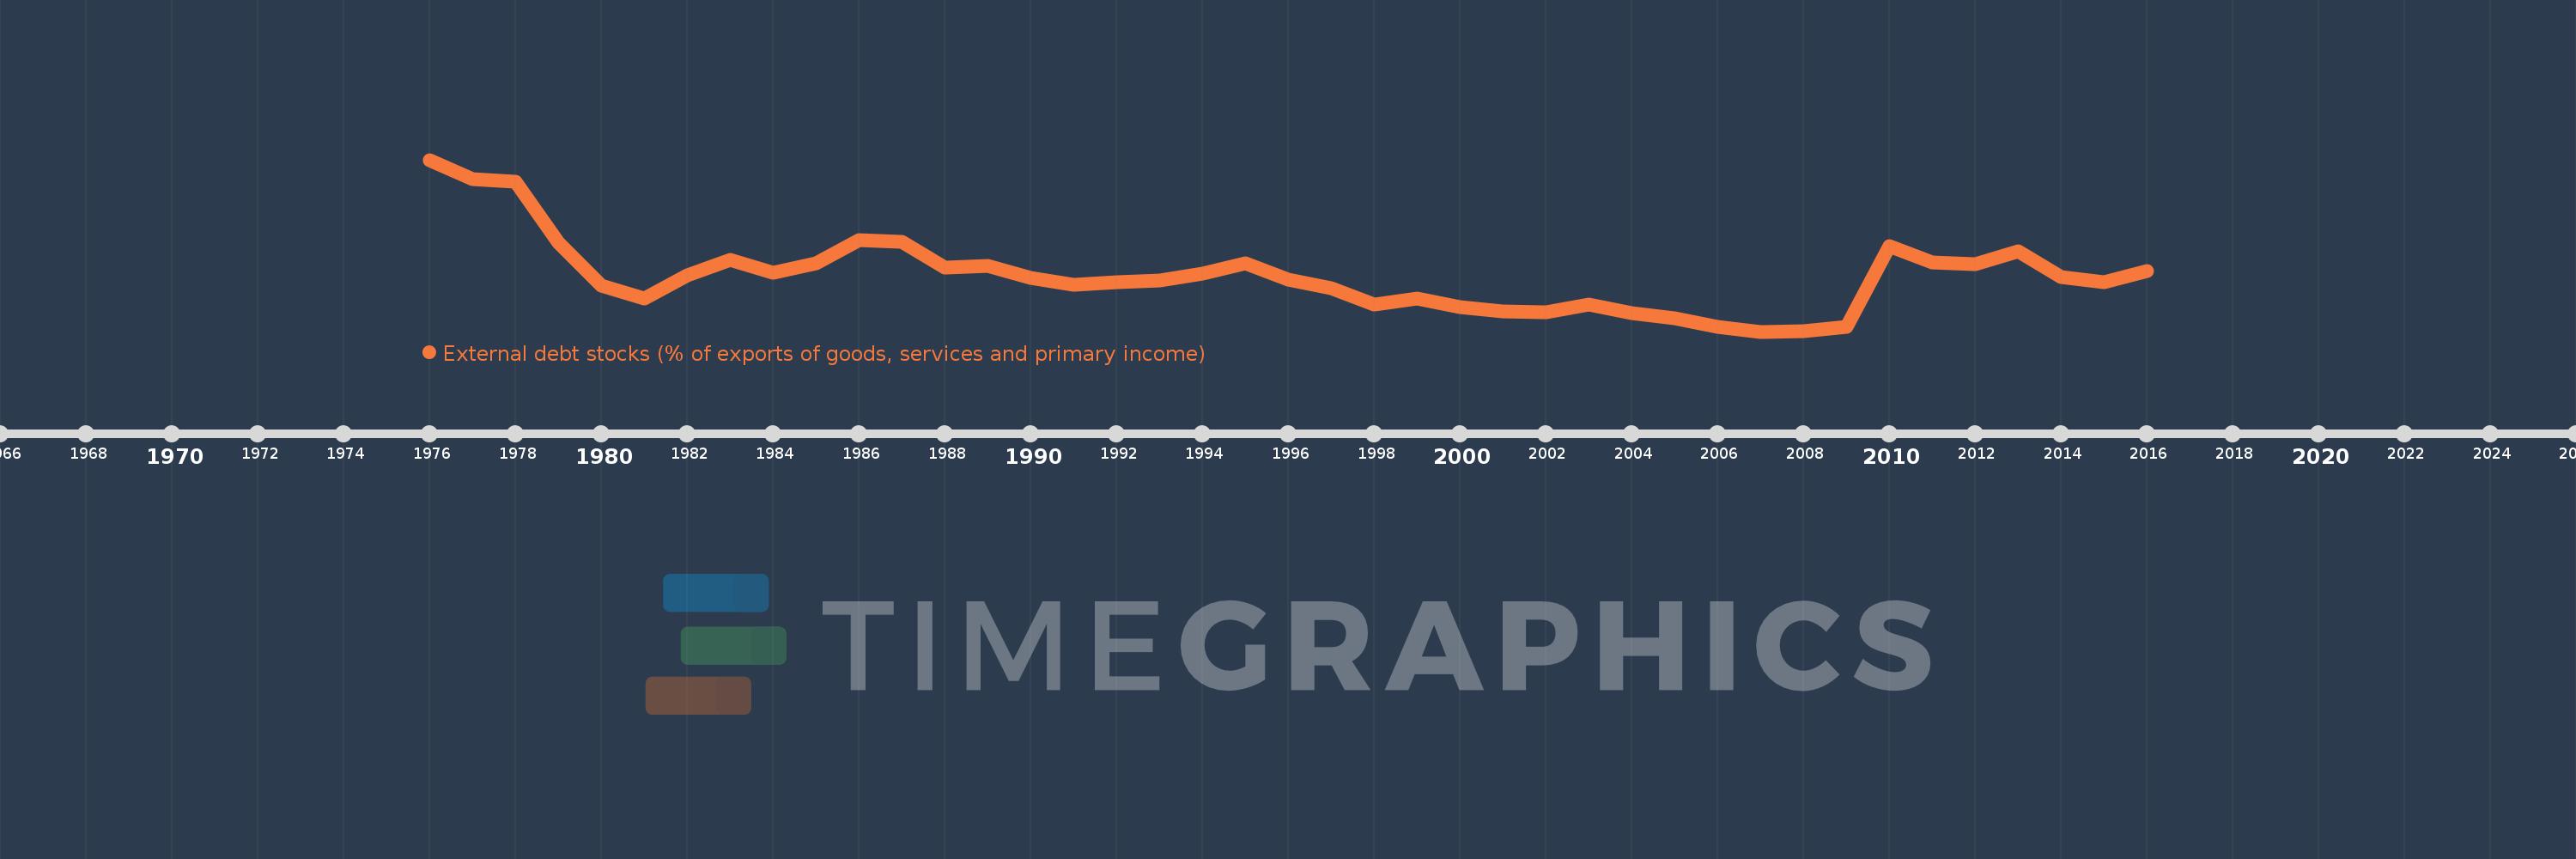
External debt stocks (% of exports of goods, services and primary income)
2016,2015,2014,2013,2012,2011,2010,2009,2008,2007,2006,2005,2004,2003,2002,2001,2000,1999,1998,1997,1996,1995,1994,1993,1992,1991,1990,1989,1988,1987,1986,1985,1984,1983,1982,1981,1980,1979,1978,1977,1976
This statistics in other country:
Timeline:
This timeline shows a graph from 1976 to 2016 of Botswana. No data until 1975. Number of actual observations by date: 41.
Source name:
World Development Indicators
Source organization:
World Bank, International Debt Statistics.
Categories, topics:
Economy & Growth, External Debt
Last updated:
apr 23, 2017
Indicators value changes by year
Maximum:
67.302
jan 1, 1976
At the date of observation
Value
Absolute change
Change from previous value
jan 1, 1976
67.302
+67.302
0.0%
jan 1, 1977
60.297
-7.005
-10.41%
jan 1, 1978
59.61
-0.687
-1.14%
jan 1, 1979
37.723
-21.887
-36.72%
jan 1, 1980
22.589
-15.134
-40.12%
jan 1, 1981
18.144
-4.446
-19.68%
jan 1, 1982
26.398
+8.254
45.5%
jan 1, 1983
31.73
+5.332
20.2%
jan 1, 1984
27.288
-4.442
-14.0%
jan 1, 1985
30.415
+3.127
11.46%
jan 1, 1986
38.891
+8.476
27.87%
jan 1, 1987
38.074
-0.817
-2.1%
jan 1, 1988
28.851
-9.224
-24.23%
jan 1, 1989
29.599
+0.748
2.59%
jan 1, 1990
25.281
-4.318
-14.59%
jan 1, 1991
22.838
-2.443
-9.66%
jan 1, 1992
23.89
+1.052
4.61%
jan 1, 1993
24.497
+0.607
2.54%
jan 1, 1994
26.903
+2.407
9.83%
jan 1, 1995
30.568
+3.665
13.62%
jan 1, 1996
24.698
-5.871
-19.21%
jan 1, 1997
21.738
-2.96
-11.98%
jan 1, 1998
15.737
-6.001
-27.61%
jan 1, 1999
18.112
+2.375
15.09%
jan 1, 2000
14.922
-3.191
-17.62%
jan 1, 2001
13.392
-1.529
-10.25%
jan 1, 2002
13.215
-0.177
-1.32%
jan 1, 2003
15.824
+2.608
19.74%
jan 1, 2004
12.695
-3.129
-19.77%
jan 1, 2005
10.98
-1.715
-13.51%
jan 1, 2006
8.025
-2.956
-26.92%
jan 1, 2007
6.267
-1.758
-21.9%
jan 1, 2008
6.426
+0.159
2.54%
jan 1, 2009
8.054
+1.628
25.33%
jan 1, 2010
36.532
+28.478
353.61%
jan 1, 2011
30.758
-5.774
-15.81%
jan 1, 2012
30.176
-0.582
-1.89%
jan 1, 2013
34.81
+4.634
15.36%
jan 1, 2014
25.786
-9.024
-25.92%
jan 1, 2015
23.838
-1.948
-7.55%
jan 1, 2016
27.732
+3.895
16.34%
Ranking of countries by current statistics by years


Comments: