29
/
en
AIzaSyAYiBZKx7MnpbEhh9jyipgxe19OcubqV5w
April 1, 2024
219520
Papua New Guinea
PNG
true
2
1
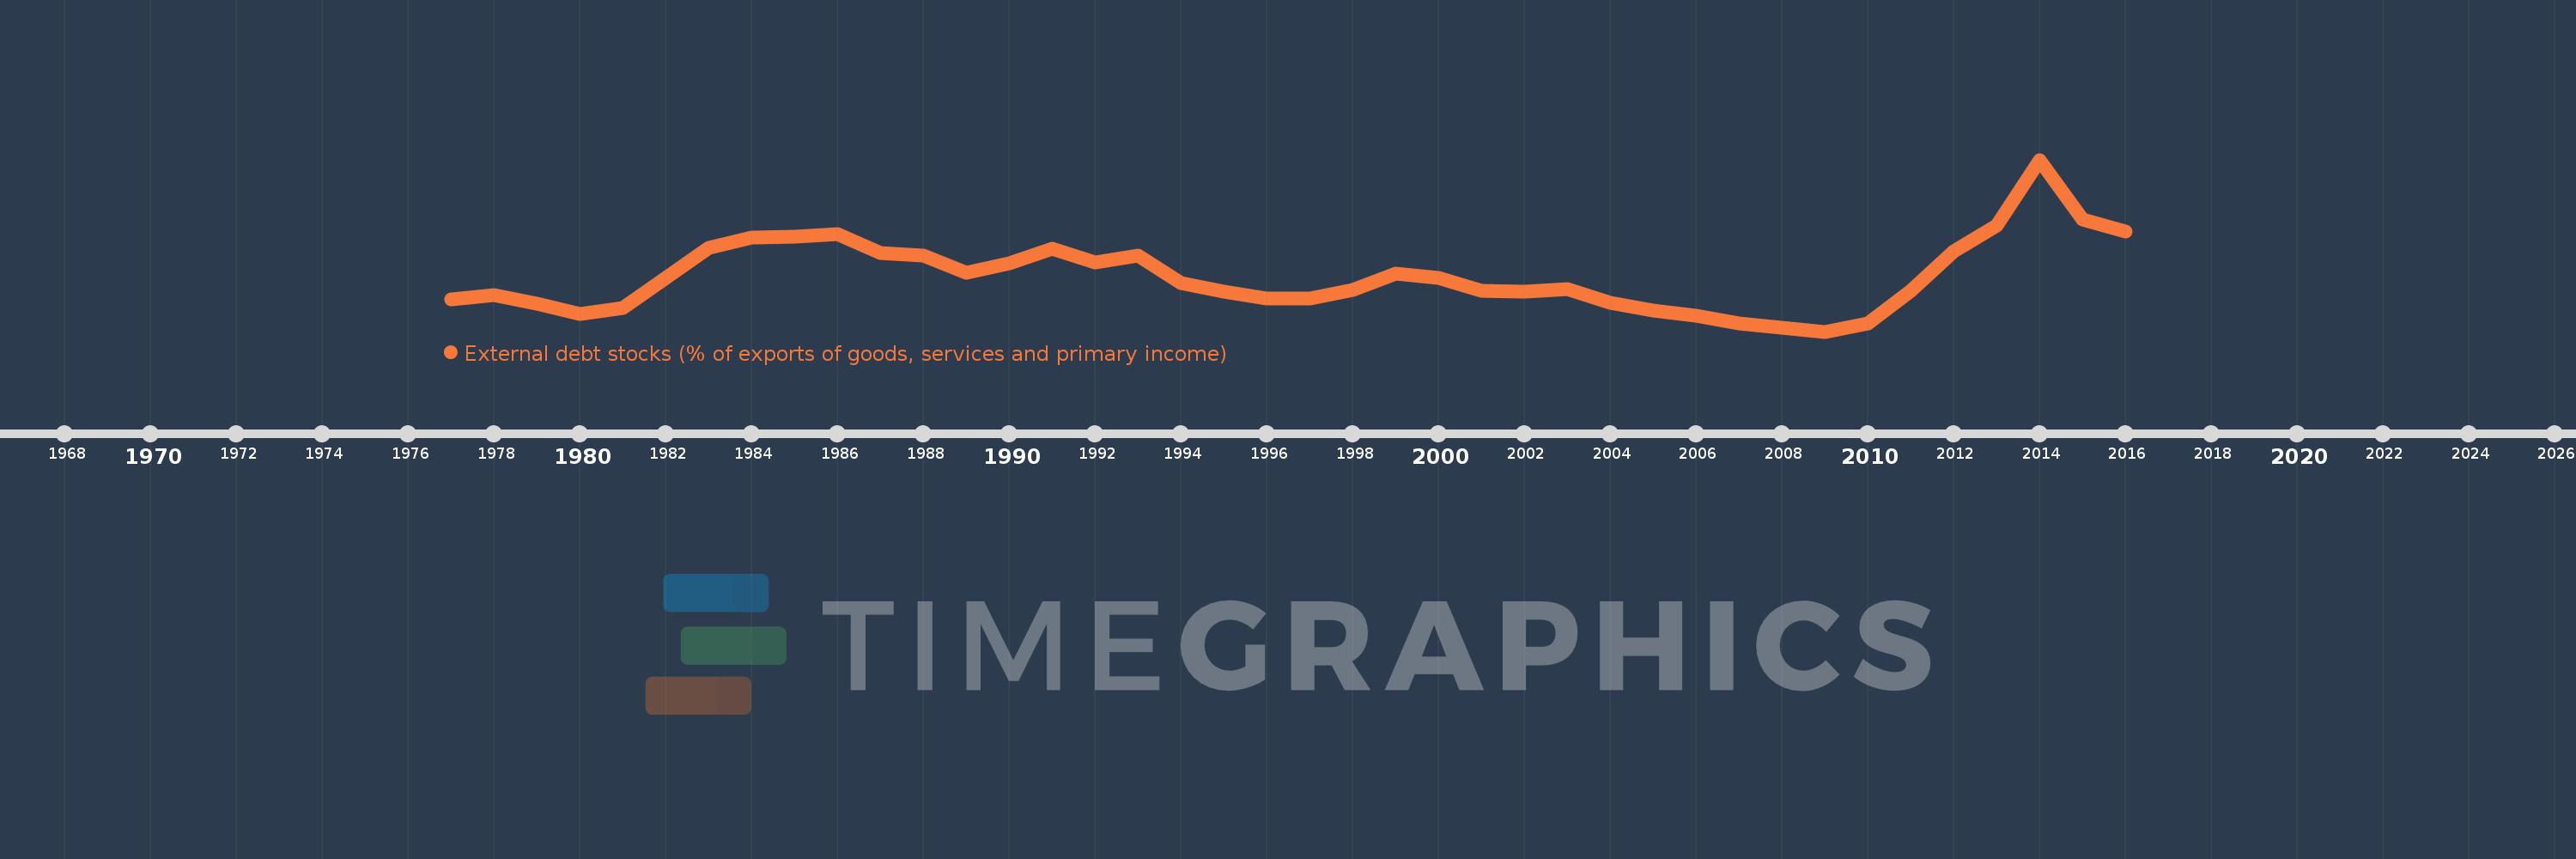
External debt stocks (% of exports of goods, services and primary income)
2016,2015,2014,2013,2012,2011,2010,2009,2008,2007,2006,2005,2004,2003,2002,2001,2000,1999,1998,1997,1996,1995,1994,1993,1992,1991,1990,1989,1988,1987,1986,1985,1984,1983,1982,1981,1980,1979,1978,1977
This statistics in other country:
Timeline:
This timeline shows a graph from 1977 to 2016 of Papua New Guinea. No data until 1976. Number of actual observations by date: 40.
Source name:
World Development Indicators
Source organization:
World Bank, International Debt Statistics.
Categories, topics:
Economy & Growth, External Debt
Last updated:
apr 23, 2017
Indicators value changes by year
Minimum:
22.948
jan 1, 2009
Maximum:
337.258
jan 1, 2014
At the date of observation
Value
Absolute change
Change from previous value
jan 1, 1977
81.481
+81.481
0.0%
jan 1, 1978
89.932
+8.451
10.37%
jan 1, 1979
74.077
-15.855
-17.63%
jan 1, 1980
55.252
-18.824
-25.41%
jan 1, 1981
66.049
+10.797
19.54%
jan 1, 1982
121.833
+55.784
84.46%
jan 1, 1983
176.179
+54.346
44.61%
jan 1, 1984
195.721
+19.542
11.09%
jan 1, 1985
196.963
+1.242
0.63%
jan 1, 1986
201.964
+5.001
2.54%
jan 1, 1987
166.077
-35.887
-17.77%
jan 1, 1988
162.666
-3.411
-2.05%
jan 1, 1989
131.097
-31.568
-19.41%
jan 1, 1990
147.212
+16.115
12.29%
jan 1, 1991
174.381
+27.169
18.46%
jan 1, 1992
149.469
-24.912
-14.29%
jan 1, 1993
162.157
+12.688
8.49%
jan 1, 1994
111.084
-51.073
-31.5%
jan 1, 1995
95.994
-15.09
-13.58%
jan 1, 1996
83.123
-12.871
-13.41%
jan 1, 1997
83.744
+0.621
0.75%
jan 1, 1998
99.899
+16.155
19.29%
jan 1, 1999
128.399
+28.5
28.53%
jan 1, 2000
121.14
-7.259
-5.65%
jan 1, 2001
98.154
-22.986
-18.97%
jan 1, 2002
96.666
-1.488
-1.52%
jan 1, 2003
101.439
+4.773
4.94%
jan 1, 2004
75.981
-25.459
-25.1%
jan 1, 2005
62.117
-13.864
-18.25%
jan 1, 2006
51.276
-10.841
-17.45%
jan 1, 2007
38.167
-13.11
-25.57%
jan 1, 2008
29.413
-8.754
-22.94%
jan 1, 2009
22.948
-6.465
-21.98%
jan 1, 2010
38.26
+15.312
66.73%
jan 1, 2011
98.201
+59.941
156.67%
jan 1, 2012
170.525
+72.324
73.65%
jan 1, 2013
217.657
+47.133
27.64%
jan 1, 2014
337.258
+119.601
54.95%
jan 1, 2015
227.394
-109.864
-32.58%
jan 1, 2016
205.614
-21.78
-9.58%
Ranking of countries by current statistics by years


Comments: