29
/
en
AIzaSyAYiBZKx7MnpbEhh9jyipgxe19OcubqV5w
April 1, 2024
230983
Rwanda
RWA
true
2
1
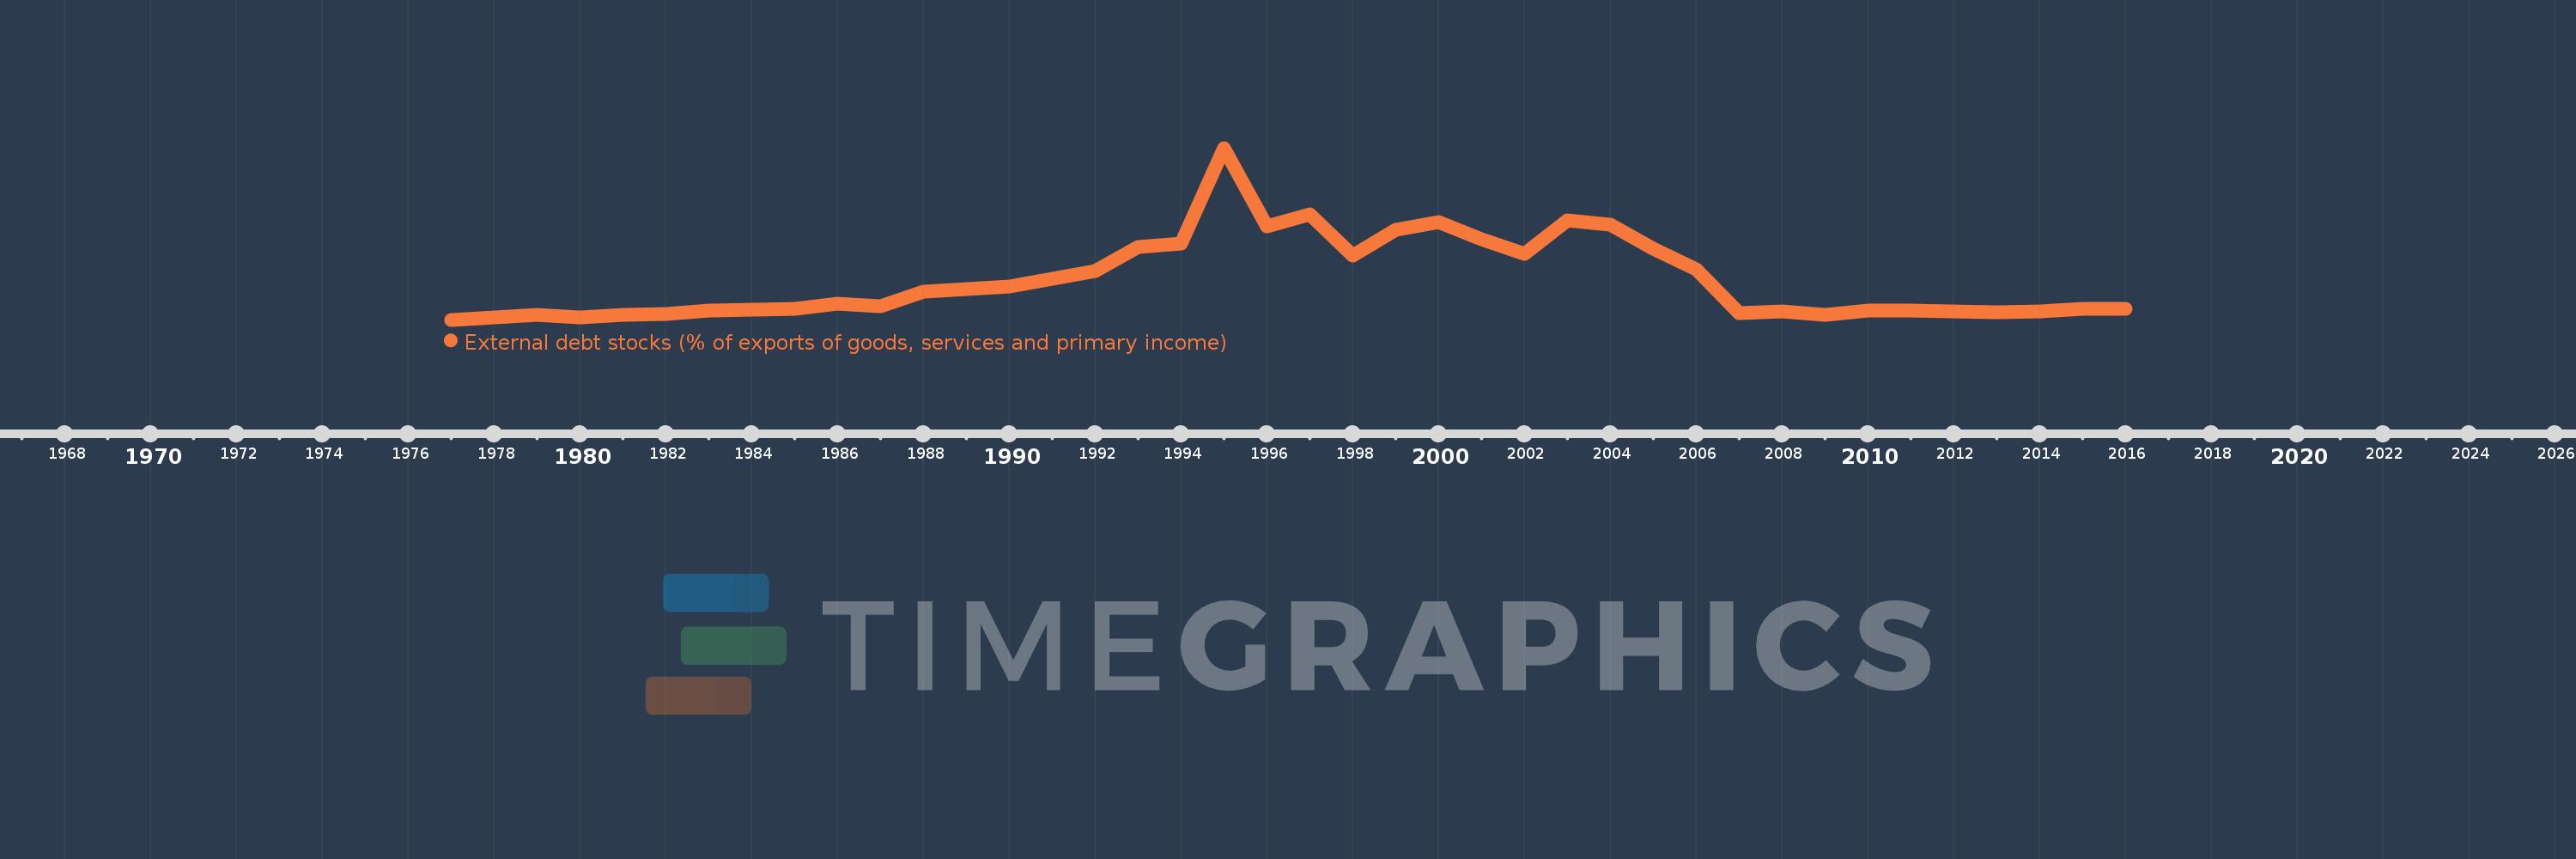
External debt stocks (% of exports of goods, services and primary income)
2016,2015,2014,2013,2012,2011,2010,2009,2008,2007,2006,2005,2004,2003,2002,2001,2000,1999,1998,1997,1996,1995,1994,1993,1992,1991,1990,1989,1988,1987,1986,1985,1984,1983,1982,1981,1980,1979,1978,1977
This statistics in other country:
Timeline:
This timeline shows a graph from 1977 to 2016 of Rwanda. No data until 1976. Number of actual observations by date: 40.
Source name:
World Development Indicators
Source organization:
World Bank, International Debt Statistics.
Categories, topics:
Economy & Growth, External Debt
Last updated:
apr 23, 2017
Indicators value changes by year
Minimum:
40.392
jan 1, 1977
Maximum:
1.895K
jan 1, 1995
At the date of observation
Value
Absolute change
Change from previous value
jan 1, 1977
40.392
+40.392
0.0%
jan 1, 1978
64.172
+23.78
58.87%
jan 1, 1979
93.819
+29.648
46.2%
jan 1, 1980
61.989
-31.83
-33.93%
jan 1, 1981
96.461
+34.472
55.61%
jan 1, 1982
104.936
+8.475
8.79%
jan 1, 1983
138.646
+33.709
32.12%
jan 1, 1984
152.516
+13.87
10.0%
jan 1, 1985
158.866
+6.35
4.16%
jan 1, 1986
214.827
+55.961
35.23%
jan 1, 1987
190.464
-24.363
-11.34%
jan 1, 1988
339.325
+148.862
78.16%
jan 1, 1989
374.064
+34.739
10.24%
jan 1, 1990
397.87
+23.807
6.36%
jan 1, 1991
483.248
+85.377
21.46%
jan 1, 1992
570.04
+86.792
17.96%
jan 1, 1993
822.66
+252.619
44.32%
jan 1, 1994
865.272
+42.612
5.18%
jan 1, 1995
1.895K
+1.03K
119.04%
jan 1, 1996
1.045K
-850.354
-44.87%
jan 1, 1997
1.177K
+131.839
12.62%
jan 1, 1998
729.946
-446.801
-37.97%
jan 1, 1999
1.013K
+283.072
38.78%
jan 1, 2000
1.093K
+80.032
7.9%
jan 1, 2001
911.458
-181.591
-16.61%
jan 1, 2002
749.586
-161.872
-17.76%
jan 1, 2003
1.11K
+360.424
48.08%
jan 1, 2004
1.068K
-42.451
-3.82%
jan 1, 2005
809.79
-257.77
-24.15%
jan 1, 2006
586.821
-222.969
-27.53%
jan 1, 2007
109.007
-477.814
-81.42%
jan 1, 2008
130.983
+21.976
20.16%
jan 1, 2009
95.621
-35.362
-27.0%
jan 1, 2010
143.032
+47.411
49.58%
jan 1, 2011
141.931
-1.102
-0.77%
jan 1, 2012
130.324
-11.606
-8.18%
jan 1, 2013
122.956
-7.368
-5.65%
jan 1, 2014
130.36
+7.403
6.02%
jan 1, 2015
160.943
+30.584
23.46%
jan 1, 2016
158.509
-2.435
-1.51%
Ranking of countries by current statistics by years


Comments: