29
/
en
AIzaSyAYiBZKx7MnpbEhh9jyipgxe19OcubqV5w
April 1, 2024
258277
Syrian Arab Republic
SYR
true
2
1
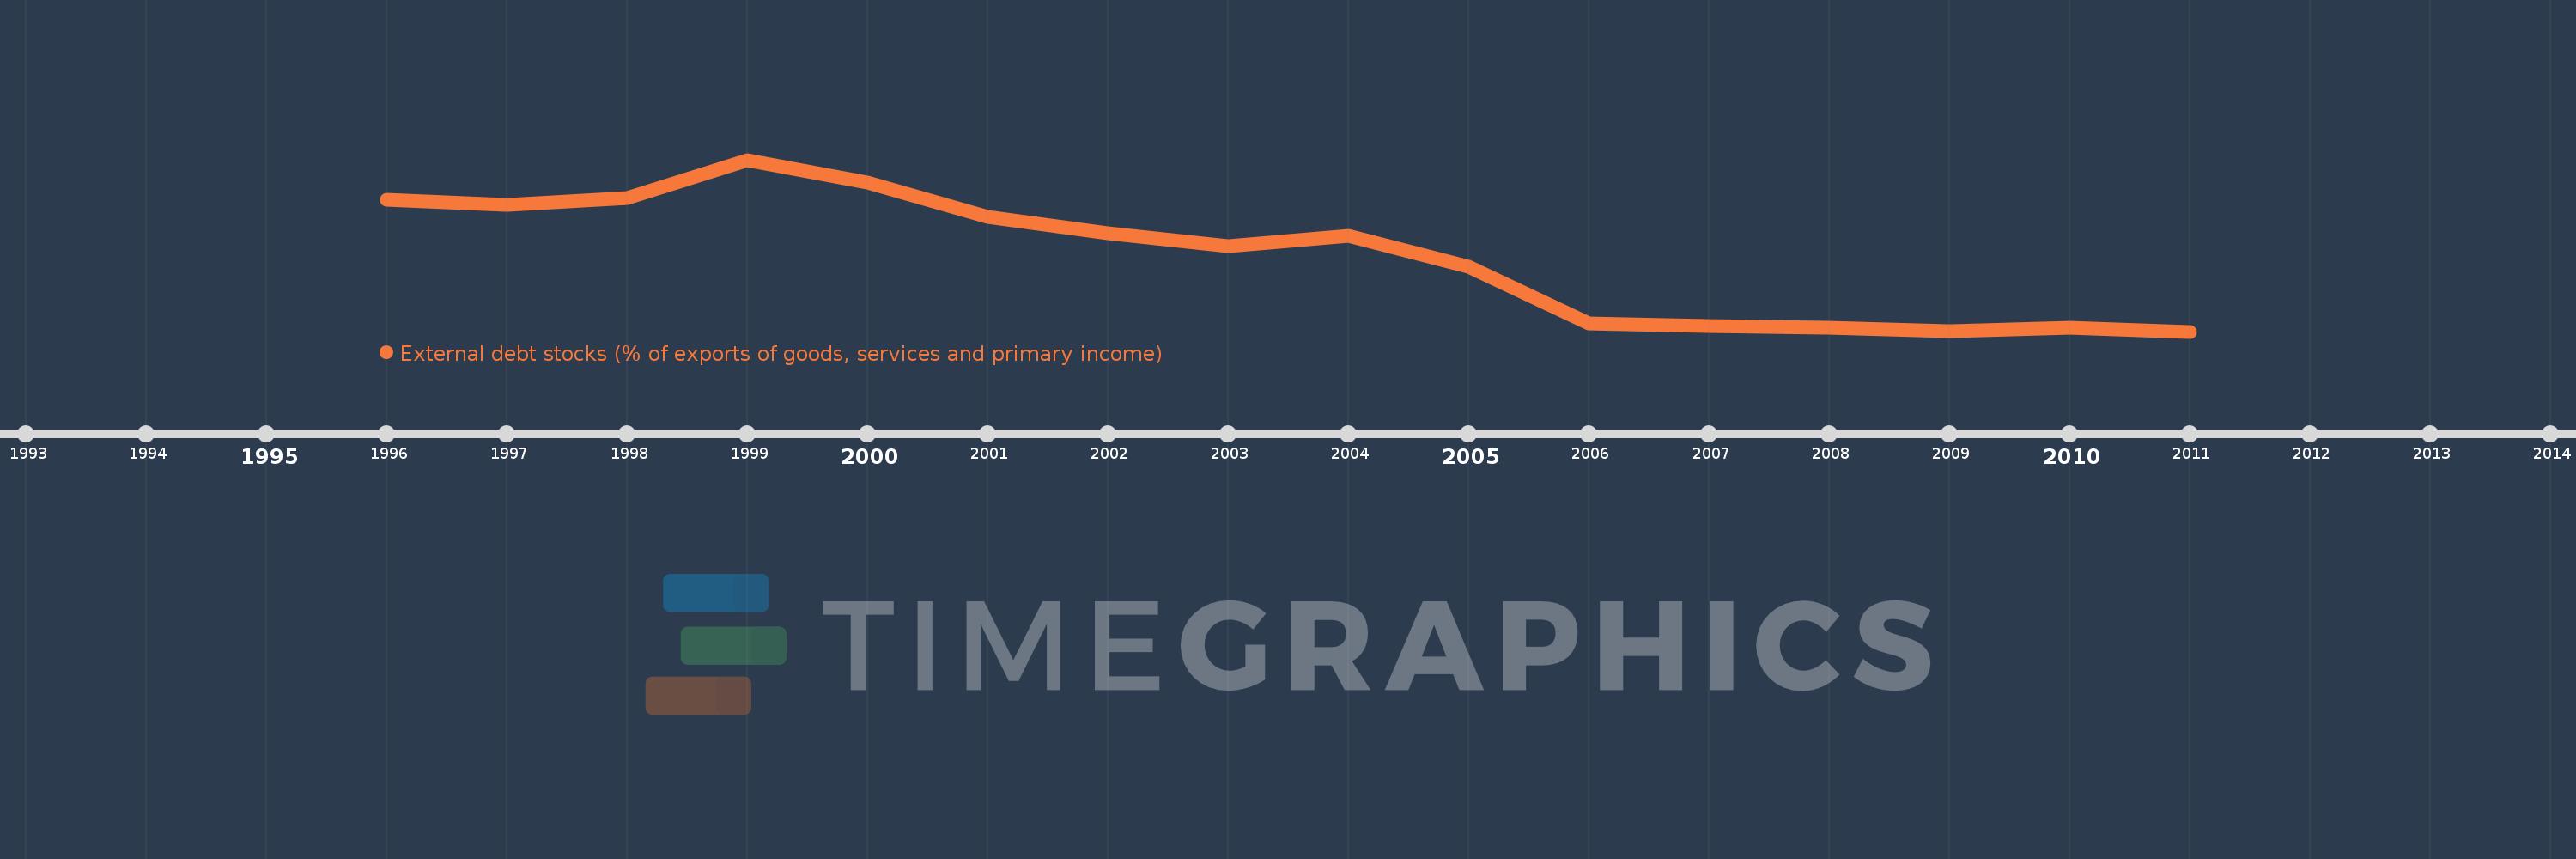
External debt stocks (% of exports of goods, services and primary income)
2011,2010,2009,2008,2007,2006,2005,2004,2003,2002,2001,2000,1999,1998,1997,1996
This statistics in other country:
Timeline:
This timeline shows a graph from 1996 to 2011 of Syrian Arab Republic. No data until 1995. Number of actual observations by date: 16.
Source name:
World Development Indicators
Source organization:
World Bank, International Debt Statistics.
Categories, topics:
Economy & Growth, External Debt
Last updated:
apr 23, 2017
Indicators value changes by year
Minimum:
26.481
jan 1, 2011
Maximum:
450.32
jan 1, 1999
At the date of observation
Value
Absolute change
Change from previous value
jan 1, 1996
351.913
+351.913
0.0%
jan 1, 1997
338.669
-13.244
-3.76%
jan 1, 1998
356.41
+17.741
5.24%
jan 1, 1999
450.32
+93.91
26.35%
jan 1, 2000
394.989
-55.331
-12.29%
jan 1, 2001
309.256
-85.733
-21.71%
jan 1, 2002
268.35
-40.907
-13.23%
jan 1, 2003
237.606
-30.743
-11.46%
jan 1, 2004
262.238
+24.632
10.37%
jan 1, 2005
186.287
-75.951
-28.96%
jan 1, 2006
46.983
-139.304
-74.78%
jan 1, 2007
40.986
-5.996
-12.76%
jan 1, 2008
35.125
-5.861
-14.3%
jan 1, 2009
26.543
-8.582
-24.43%
jan 1, 2010
35.475
+8.932
33.65%
jan 1, 2011
26.481
-8.993
-25.35%
Ranking of countries by current statistics by years


Comments: