29
/
en
AIzaSyAYiBZKx7MnpbEhh9jyipgxe19OcubqV5w
April 1, 2024
130400
Ethiopia
ETH
true
2
1
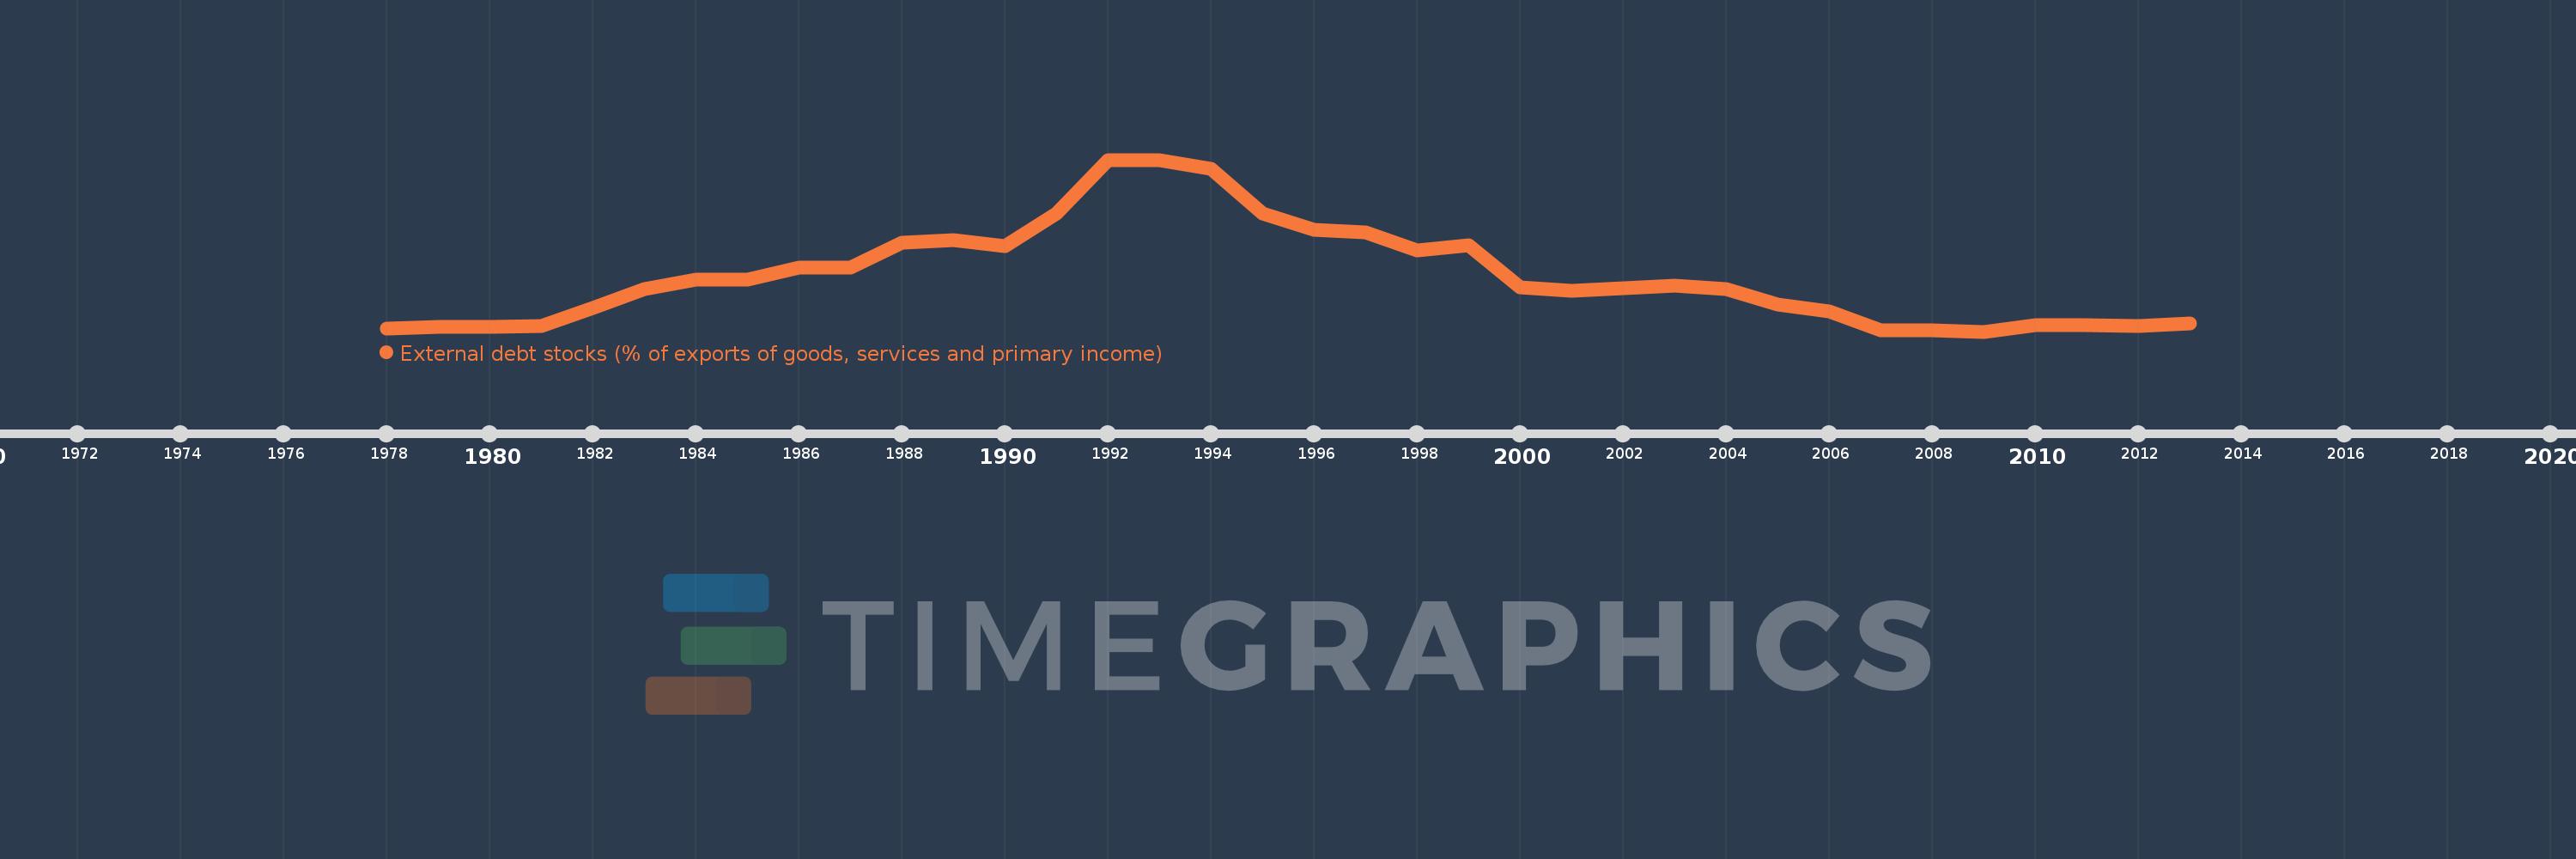
External debt stocks (% of exports of goods, services and primary income)
2013,2012,2011,2010,2009,2008,2007,2006,2005,2004,2003,2002,2001,2000,1999,1998,1997,1996,1995,1994,1993,1992,1991,1990,1989,1988,1987,1986,1985,1984,1983,1982,1981,1980,1979,1978
This statistics in other country:
Timeline:
This timeline shows a graph from 1978 to 2013 of Ethiopia. No data until 1977. Number of actual observations by date: 36.
Source name:
World Development Indicators
Source organization:
World Bank, International Debt Statistics.
Categories, topics:
Economy & Growth, External Debt
Last updated:
apr 23, 2017
Indicators value changes by year
Minimum:
82.209
jan 1, 2009
Maximum:
2.035K
jan 1, 1993
At the date of observation
Value
Absolute change
Change from previous value
jan 1, 1978
114.722
+114.722
0.0%
jan 1, 1979
140.515
+25.793
22.48%
jan 1, 1980
137.777
-2.738
-1.95%
jan 1, 1981
143.783
+6.007
4.36%
jan 1, 1982
346.691
+202.908
141.12%
jan 1, 1983
566.099
+219.408
63.29%
jan 1, 1984
671.974
+105.875
18.7%
jan 1, 1985
673.326
+1.352
0.2%
jan 1, 1986
806.353
+133.027
19.76%
jan 1, 1987
813.754
+7.401
0.92%
jan 1, 1988
1.095K
+280.877
34.52%
jan 1, 1989
1.12K
+25.579
2.34%
jan 1, 1990
1.054K
-66.691
-5.95%
jan 1, 1991
1.427K
+373.563
35.46%
jan 1, 1992
2.028K
+601.084
42.12%
jan 1, 1993
2.035K
+6.654
0.33%
jan 1, 1994
1.936K
-99.142
-4.87%
jan 1, 1995
1.421K
-514.994
-26.61%
jan 1, 1996
1.235K
-185.626
-13.07%
jan 1, 1997
1.207K
-27.765
-2.25%
jan 1, 1998
1.006K
-201.489
-16.69%
jan 1, 1999
1.065K
+59.121
5.88%
jan 1, 2000
581.891
-483.034
-45.36%
jan 1, 2001
547.001
-34.89
-6.0%
jan 1, 2002
579.234
+32.233
5.89%
jan 1, 2003
607.678
+28.444
4.91%
jan 1, 2004
570.226
-37.451
-6.16%
jan 1, 2005
386.13
-184.097
-32.28%
jan 1, 2006
315.746
-70.383
-18.23%
jan 1, 2007
101.175
-214.572
-67.96%
jan 1, 2008
97.4
-3.774
-3.73%
jan 1, 2009
82.209
-15.191
-15.6%
jan 1, 2010
157.611
+75.402
91.72%
jan 1, 2011
157.652
+0.04
0.03%
jan 1, 2012
147.838
-9.814
-6.22%
jan 1, 2013
174.282
+26.445
17.89%
Ranking of countries by current statistics by years


Comments: