29
/
en
AIzaSyAYiBZKx7MnpbEhh9jyipgxe19OcubqV5w
April 1, 2024
128241
Eritrea
ERI
true
2
1
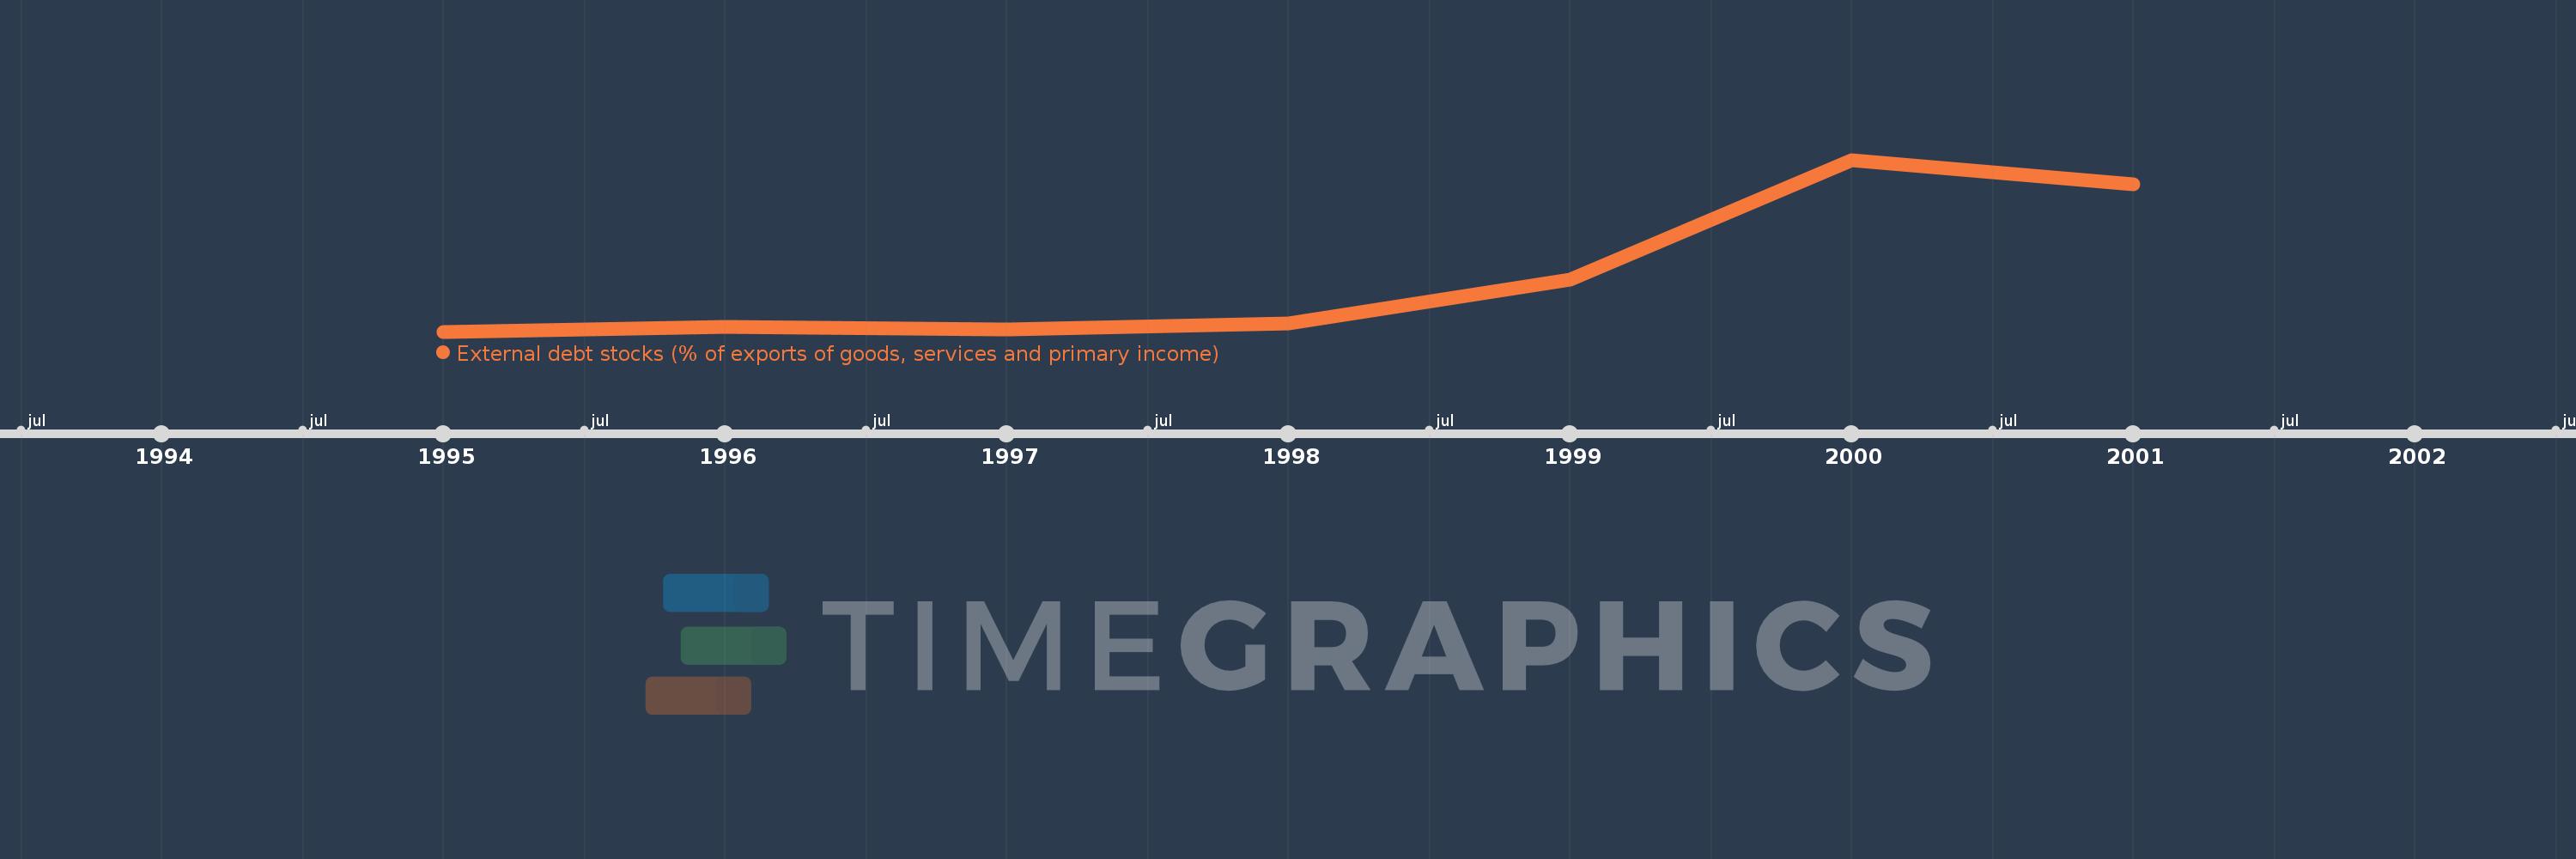
External debt stocks (% of exports of goods, services and primary income)
2001,2000,1999,1998,1997,1996,1995
This statistics in other country:
Timeline:
This timeline shows a graph from 1995 to 2001 of Eritrea. No data until 1994. Number of actual observations by date: 7.
Source name:
World Development Indicators
Source organization:
World Bank, International Debt Statistics.
Categories, topics:
Economy & Growth, External Debt
Last updated:
apr 23, 2017
Indicators value changes by year
Minimum:
16.943
jan 1, 1995
Maximum:
356.396
jan 1, 2000
At the date of observation
Value
Absolute change
Change from previous value
jan 1, 1995
16.943
+16.943
0.0%
jan 1, 1996
25.766
+8.823
52.08%
jan 1, 1997
20.968
-4.798
-18.62%
jan 1, 1998
33.271
+12.303
58.67%
jan 1, 1999
120.362
+87.091
261.76%
jan 1, 2000
356.396
+236.034
196.1%
jan 1, 2001
308.531
-47.865
-13.43%
Ranking of countries by current statistics by years


Comments: