29
/
en
AIzaSyAYiBZKx7MnpbEhh9jyipgxe19OcubqV5w
April 1, 2024
166083
Kazakhstan
KAZ
true
2
1
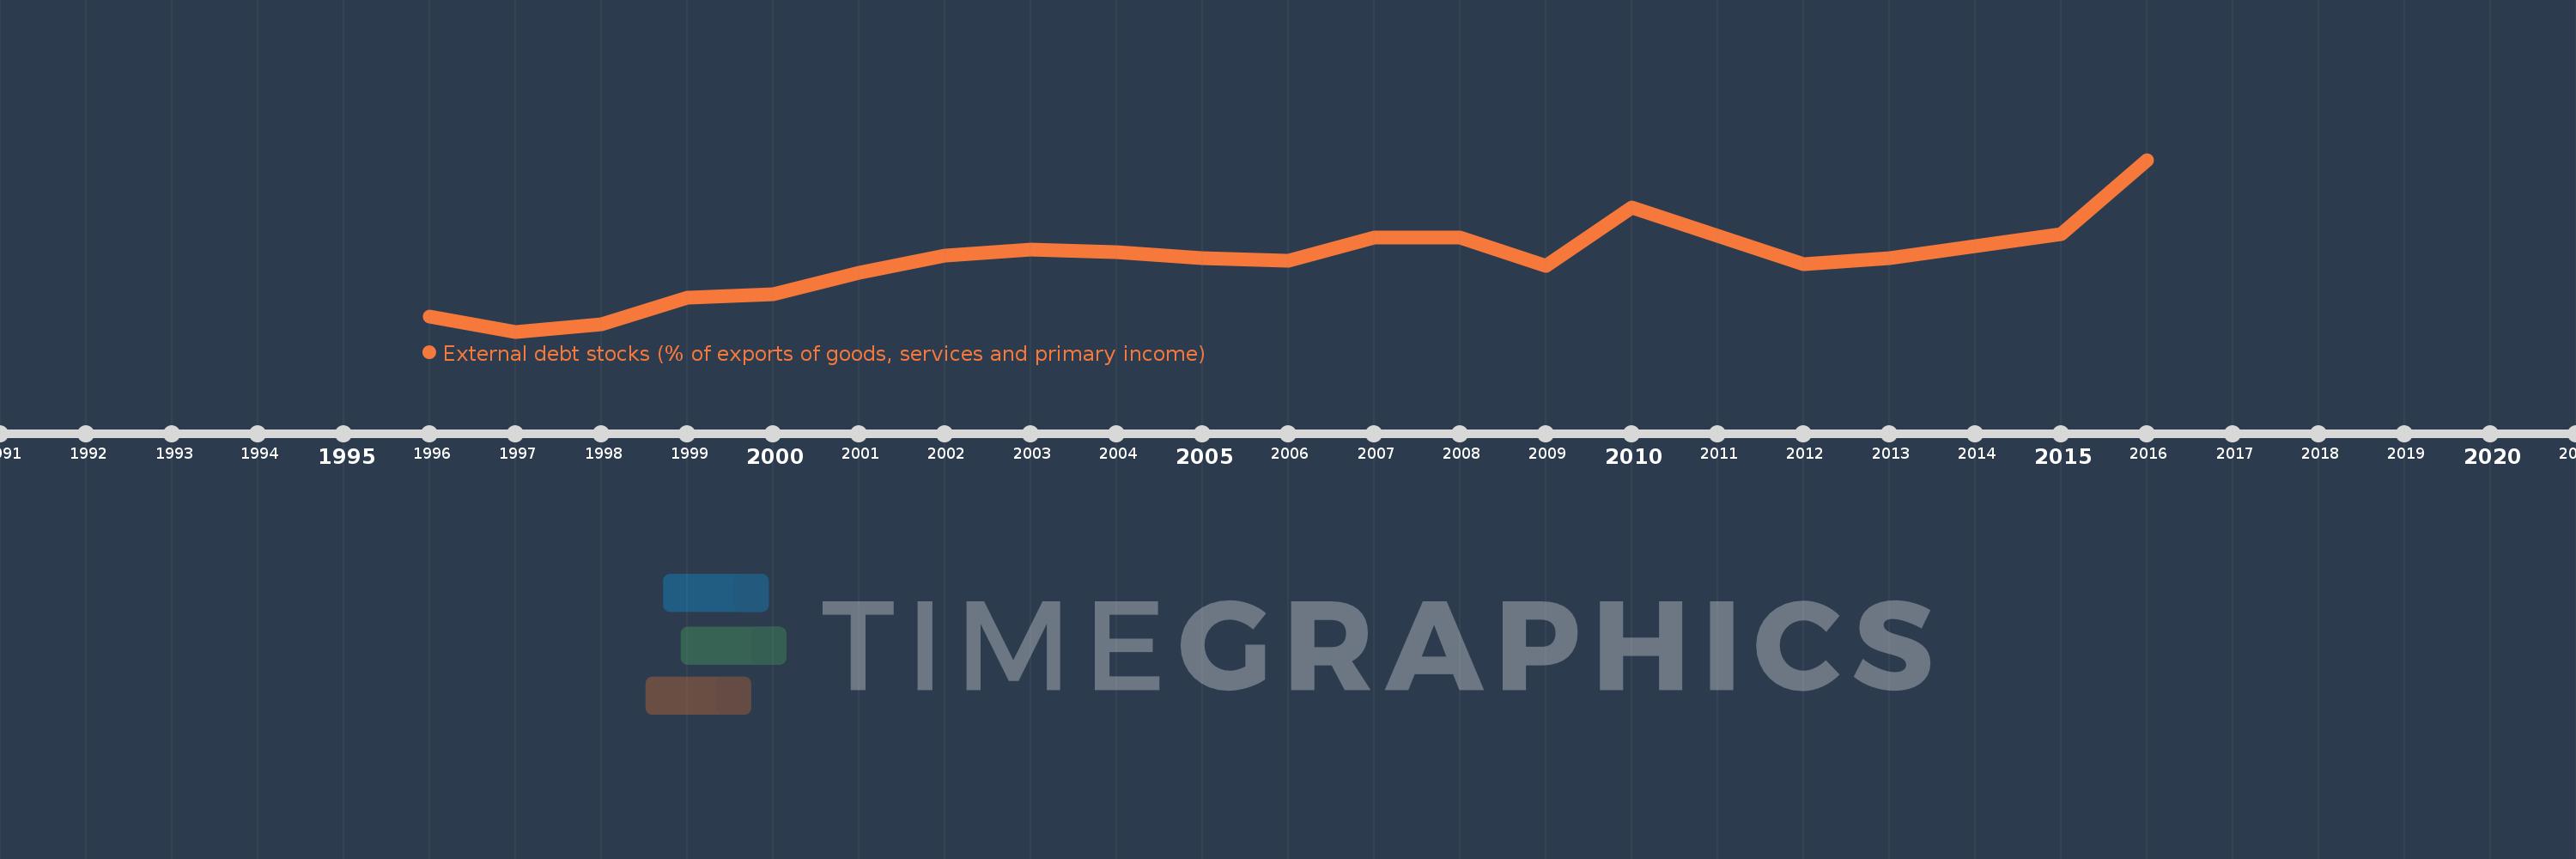
External debt stocks (% of exports of goods, services and primary income)
2016,2015,2014,2013,2012,2011,2010,2009,2008,2007,2006,2005,2004,2003,2002,2001,2000,1999,1998,1997,1996
This statistics in other country:
Timeline:
This timeline shows a graph from 1996 to 2016 of Kazakhstan. No data until 1995. Number of actual observations by date: 21.
Source name:
World Development Indicators
Source organization:
World Bank, International Debt Statistics.
Categories, topics:
Economy & Growth, External Debt
Last updated:
apr 23, 2017
Indicators value changes by year
Minimum:
41.611
jan 1, 1997
Maximum:
280.959
jan 1, 2016
At the date of observation
Value
Absolute change
Change from previous value
jan 1, 1996
62.3
+62.3
0.0%
jan 1, 1997
41.611
-20.689
-33.21%
jan 1, 1998
52.181
+10.57
25.4%
jan 1, 1999
88.421
+36.24
69.45%
jan 1, 2000
93.891
+5.47
6.19%
jan 1, 2001
122.999
+29.108
31.0%
jan 1, 2002
147.234
+24.234
19.7%
jan 1, 2003
156.132
+8.899
6.04%
jan 1, 2004
152.638
-3.495
-2.24%
jan 1, 2005
144.038
-8.6
-5.63%
jan 1, 2006
139.761
-4.277
-2.97%
jan 1, 2007
172.231
+32.47
23.23%
jan 1, 2008
173.116
+0.885
0.51%
jan 1, 2009
133.419
-39.698
-22.93%
jan 1, 2010
214.303
+80.884
60.62%
jan 1, 2011
174.668
-39.635
-18.49%
jan 1, 2012
135.475
-39.193
-22.44%
jan 1, 2013
144.379
+8.904
6.57%
jan 1, 2014
160.548
+16.169
11.2%
jan 1, 2015
177.215
+16.667
10.38%
jan 1, 2016
280.959
+103.744
58.54%
Ranking of countries by current statistics by years


Comments: