29
/
en
AIzaSyAYiBZKx7MnpbEhh9jyipgxe19OcubqV5w
April 1, 2024
64647
Albania
ALB
true
2
1
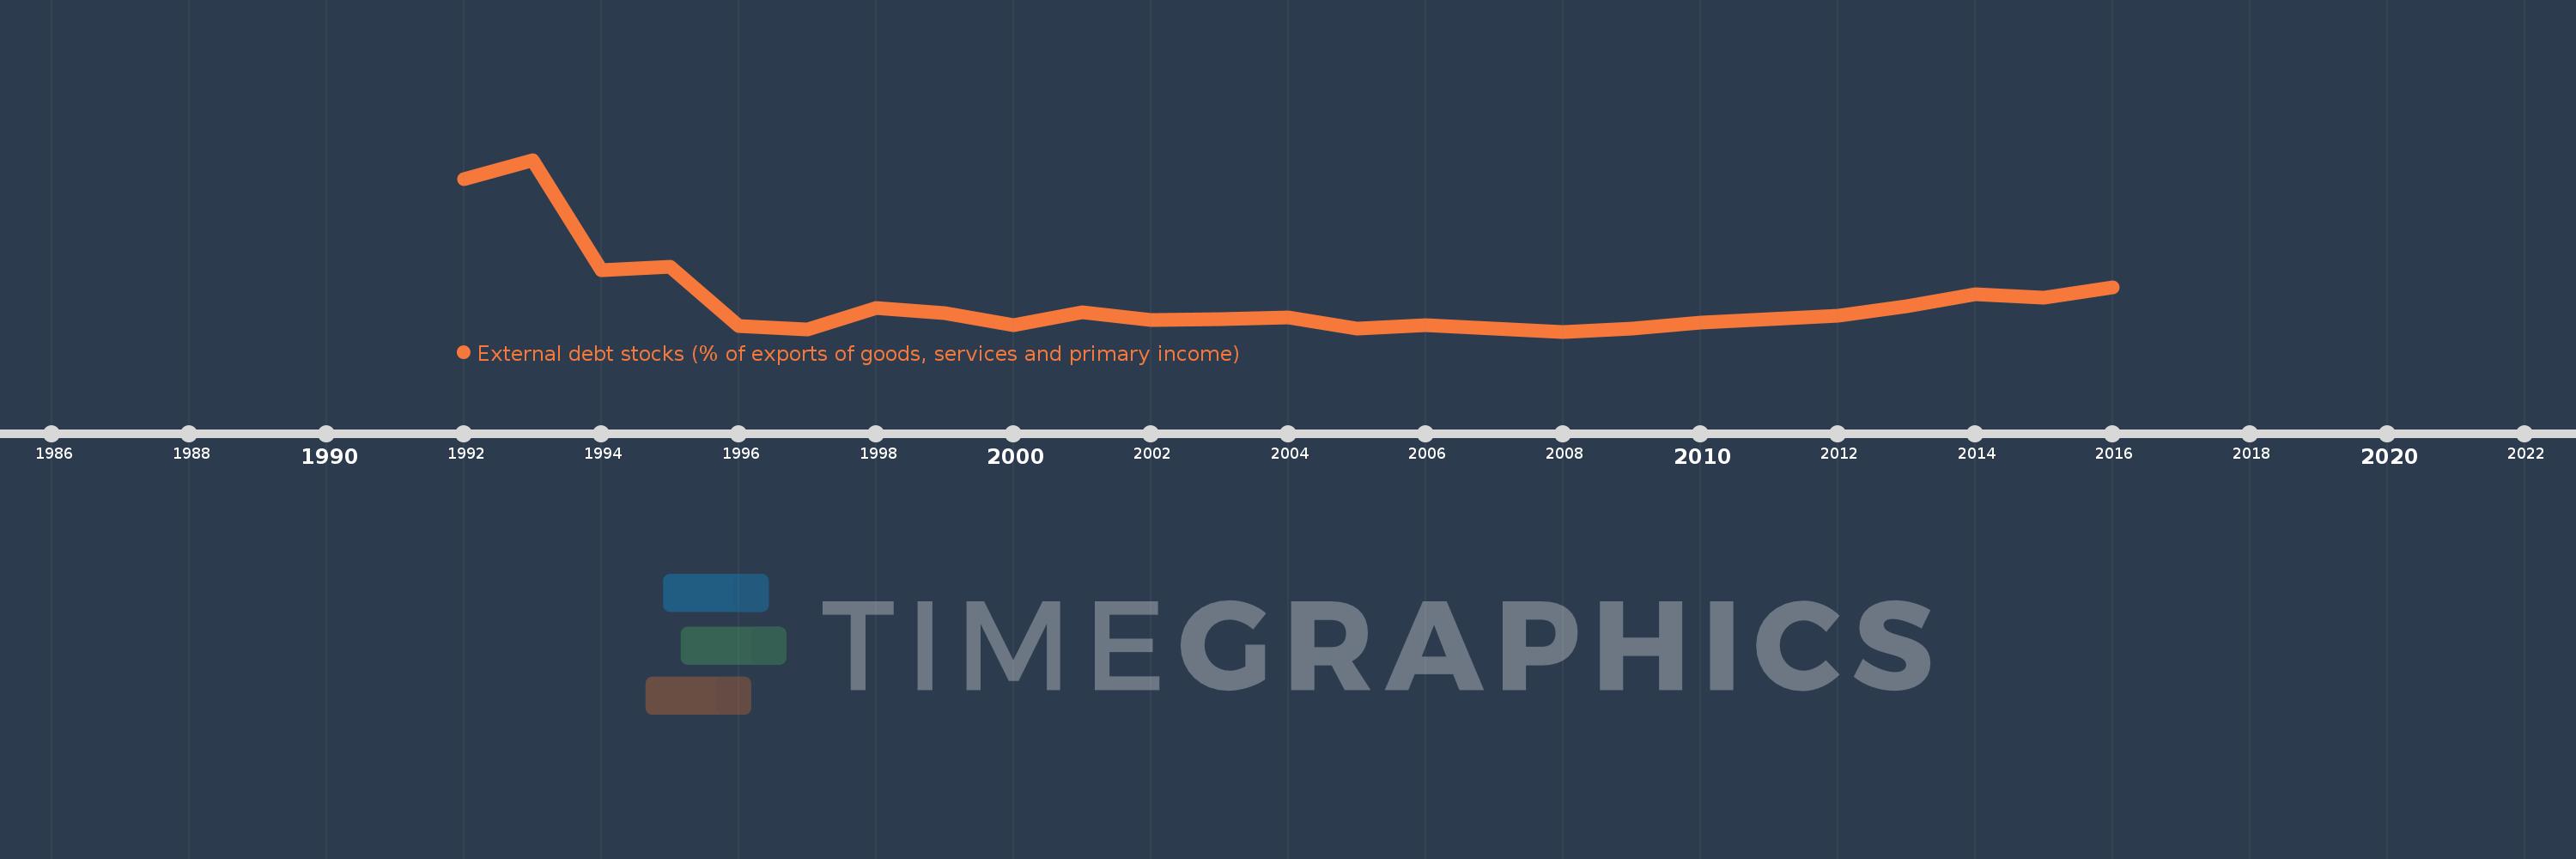
External debt stocks (% of exports of goods, services and primary income)
2016,2015,2014,2013,2012,2011,2010,2009,2008,2007,2006,2005,2004,2003,2002,2001,2000,1999,1998,1997,1996,1995,1994,1993,1992
This statistics in other country:
Timeline:
This timeline shows a graph from 1992 to 2016 of Albania. No data until 1991. Number of actual observations by date: 25.
Source name:
World Development Indicators
Source organization:
World Bank, International Debt Statistics.
Categories, topics:
Economy & Growth, External Debt
Last updated:
apr 23, 2017
Indicators value changes by year
Minimum:
101.948
jan 1, 2008
Maximum:
680.97
jan 1, 1993
At the date of observation
Value
Absolute change
Change from previous value
jan 1, 1992
616.247
+616.247
0.0%
jan 1, 1993
680.97
+64.723
10.5%
jan 1, 1994
309.34
-371.629
-54.57%
jan 1, 1995
320.55
+11.209
3.62%
jan 1, 1996
122.135
-198.415
-61.9%
jan 1, 1997
107.751
-14.383
-11.78%
jan 1, 1998
181.999
+74.248
68.91%
jan 1, 1999
163.828
-18.172
-9.98%
jan 1, 2000
122.732
-41.095
-25.08%
jan 1, 2001
167.419
+44.687
36.41%
jan 1, 2002
140.725
-26.694
-15.94%
jan 1, 2003
144.893
+4.168
2.96%
jan 1, 2004
149.106
+4.214
2.91%
jan 1, 2005
110.656
-38.45
-25.79%
jan 1, 2006
124.685
+14.029
12.68%
jan 1, 2007
112.147
-12.538
-10.06%
jan 1, 2008
101.948
-10.199
-9.09%
jan 1, 2009
113.095
+11.147
10.93%
jan 1, 2010
133.53
+20.435
18.07%
jan 1, 2011
145.142
+11.612
8.7%
jan 1, 2012
154.829
+9.687
6.67%
jan 1, 2013
188.443
+33.614
21.71%
jan 1, 2014
228.156
+39.713
21.07%
jan 1, 2015
215.339
-12.817
-5.62%
jan 1, 2016
252.354
+37.015
17.19%
Ranking of countries by current statistics by years


Comments: