29
/
en
AIzaSyAYiBZKx7MnpbEhh9jyipgxe19OcubqV5w
April 1, 2024
157229
Iran, Islamic Rep.
IRN
true
2
1
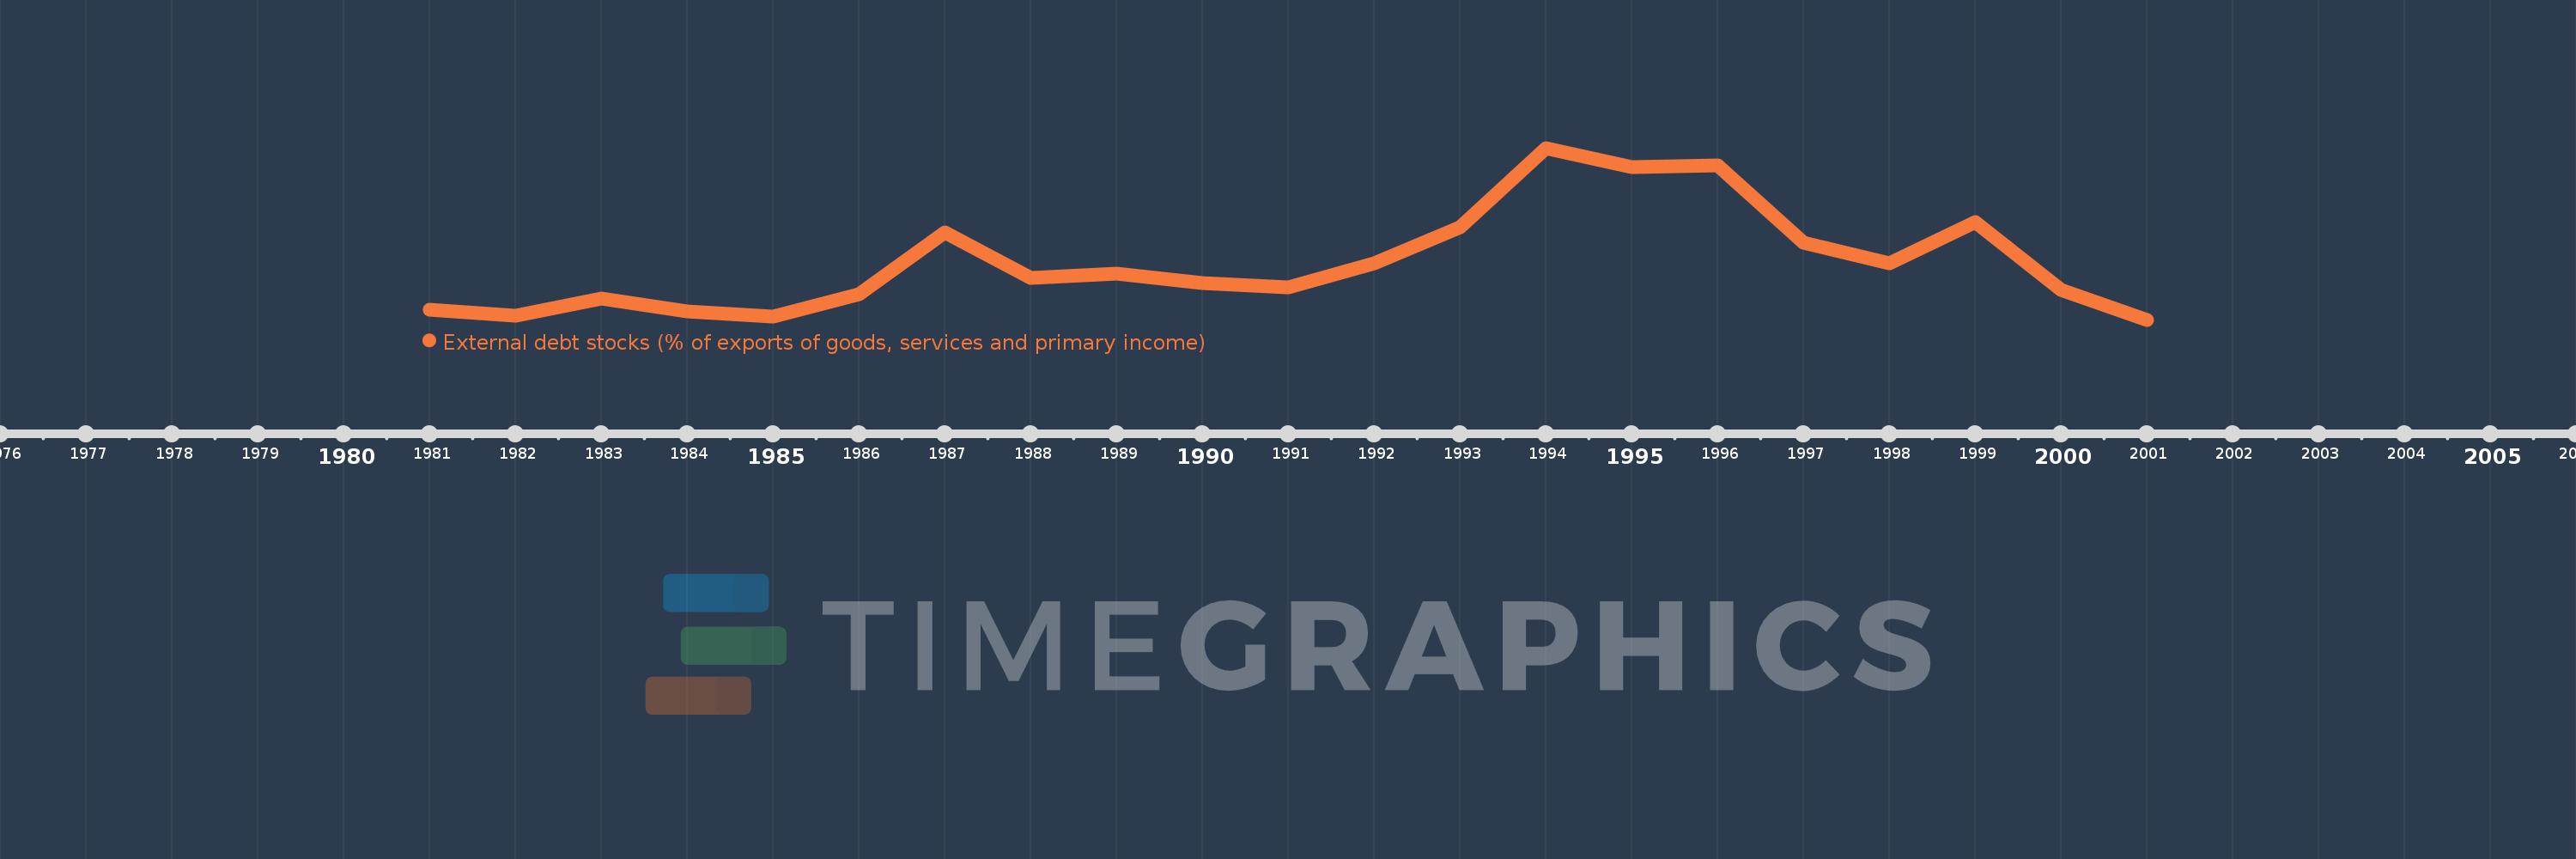
External debt stocks (% of exports of goods, services and primary income)
2001,2000,1999,1998,1997,1996,1995,1994,1993,1992,1991,1990,1989,1988,1987,1986,1985,1984,1983,1982,1981
This statistics in other country:
Timeline:
This timeline shows a graph from 1981 to 2001 of Iran, Islamic Rep.. No data until 1980. Number of actual observations by date: 21.
Source name:
World Development Indicators
Source organization:
World Bank, International Debt Statistics.
Categories, topics:
Economy & Growth, External Debt
Last updated:
apr 23, 2017
Indicators value changes by year
Minimum:
26.632
jan 1, 2001
Maximum:
121.679
jan 1, 1994
At the date of observation
Value
Absolute change
Change from previous value
jan 1, 1981
31.979
+31.979
0.0%
jan 1, 1982
29.041
-2.938
-9.19%
jan 1, 1983
38.176
+9.135
31.46%
jan 1, 1984
31.114
-7.062
-18.5%
jan 1, 1985
28.419
-2.695
-8.66%
jan 1, 1986
40.548
+12.129
42.68%
jan 1, 1987
74.915
+34.367
84.76%
jan 1, 1988
49.739
-25.176
-33.61%
jan 1, 1989
52.171
+2.432
4.89%
jan 1, 1990
46.966
-5.204
-9.98%
jan 1, 1991
44.662
-2.304
-4.91%
jan 1, 1992
57.978
+13.315
29.81%
jan 1, 1993
77.647
+19.669
33.92%
jan 1, 1994
121.679
+44.032
56.71%
jan 1, 1995
111.13
-10.549
-8.67%
jan 1, 1996
111.915
+0.785
0.71%
jan 1, 1997
69.361
-42.555
-38.02%
jan 1, 1998
58.082
-11.279
-16.26%
jan 1, 1999
80.675
+22.593
38.9%
jan 1, 2000
43.137
-37.537
-46.53%
jan 1, 2001
26.632
-16.505
-38.26%
Ranking of countries by current statistics by years


Comments: