29
/
en
AIzaSyAYiBZKx7MnpbEhh9jyipgxe19OcubqV5w
April 1, 2024
85882
Bhutan
BTN
true
2
1
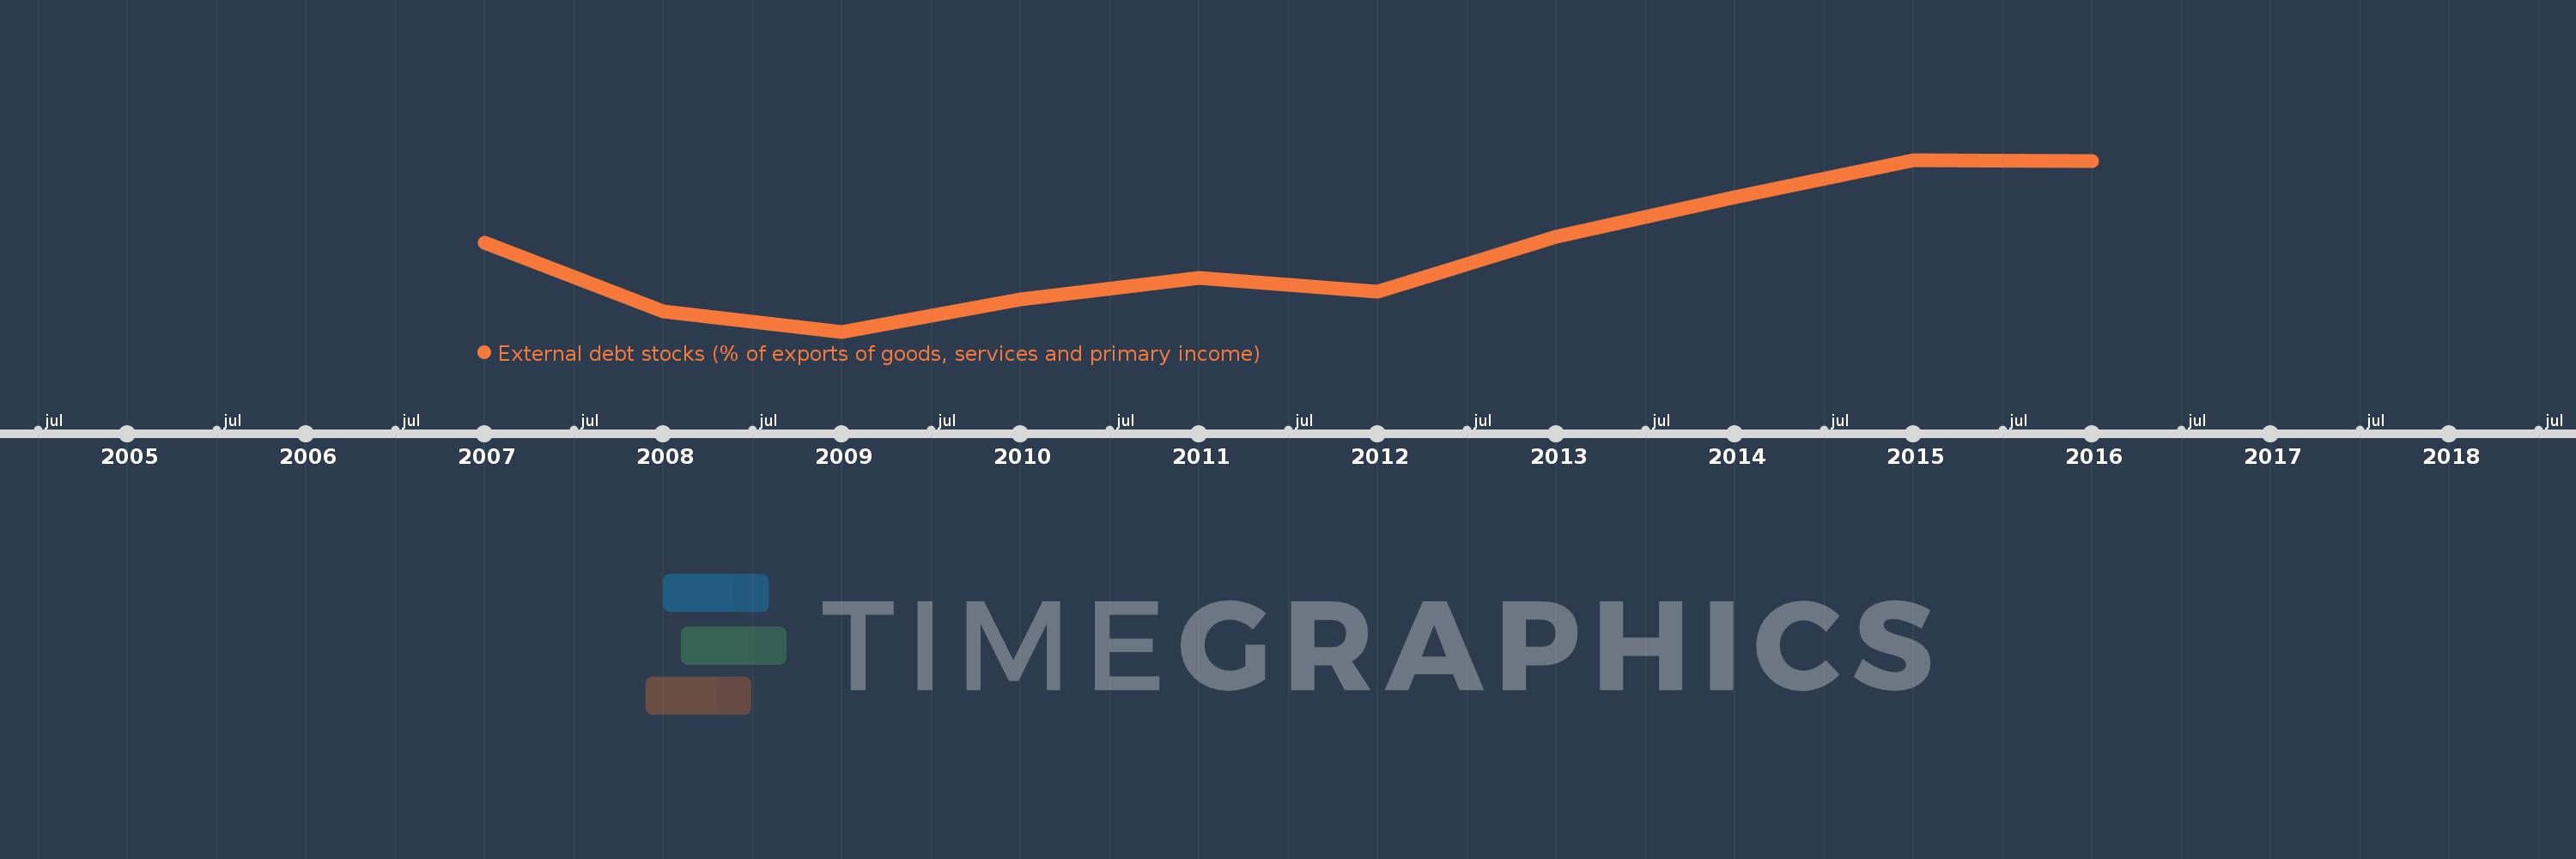
External debt stocks (% of exports of goods, services and primary income)
2016,2015,2014,2013,2012,2011,2010,2009,2008,2007
This statistics in other country:
Timeline:
This timeline shows a graph from 2007 to 2016 of Bhutan. No data until 2006. Number of actual observations by date: 10.
Source name:
World Development Indicators
Source organization:
World Bank, International Debt Statistics.
Categories, topics:
Economy & Growth, External Debt
Last updated:
apr 23, 2017
Indicators value changes by year
Minimum:
100.689
jan 1, 2009
Maximum:
270.583
jan 1, 2015
At the date of observation
Value
Absolute change
Change from previous value
jan 1, 2007
188.815
+188.815
0.0%
jan 1, 2008
120.826
-67.989
-36.01%
jan 1, 2009
100.689
-20.137
-16.67%
jan 1, 2010
132.133
+31.445
31.23%
jan 1, 2011
154.007
+21.873
16.55%
jan 1, 2012
140.589
-13.417
-8.71%
jan 1, 2013
194.207
+53.617
38.14%
jan 1, 2014
233.9
+39.693
20.44%
jan 1, 2015
270.583
+36.684
15.68%
jan 1, 2016
269.075
-1.508
-0.56%
Ranking of countries by current statistics by years


Comments: