29
/
en
AIzaSyAYiBZKx7MnpbEhh9jyipgxe19OcubqV5w
April 1, 2024
285836
Zambia
ZMB
true
2
1
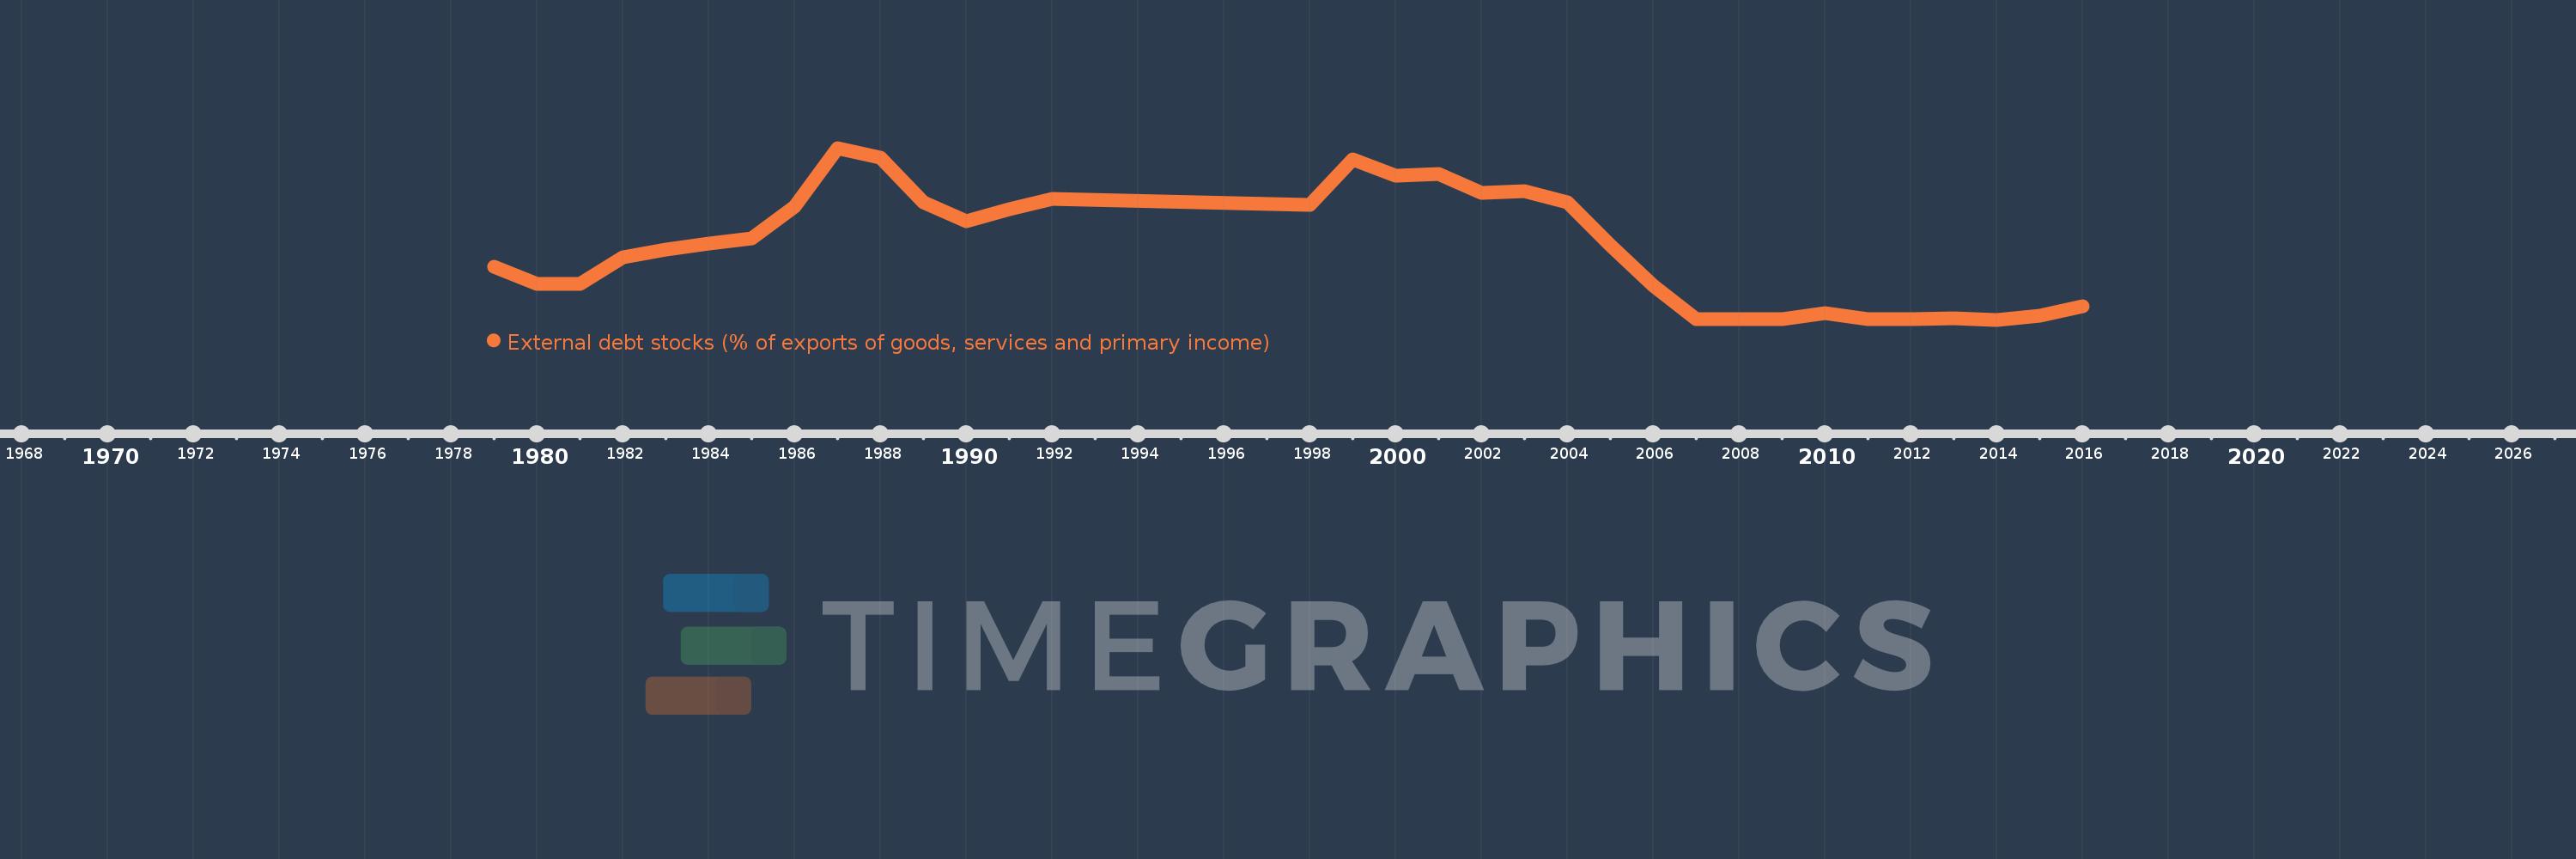
External debt stocks (% of exports of goods, services and primary income)
2016,2015,2014,2013,2012,2011,2010,2009,2008,2007,2006,2005,2004,2003,2002,2001,2000,1999,1998,1992,1991,1990,1989,1988,1987,1986,1985,1984,1983,1982,1981,1980,1979
This statistics in other country:
Timeline:
This timeline shows a graph from 1979 to 2016 of Zambia. No data until 1978. Number of actual observations by date: 33.
Source name:
World Development Indicators
Source organization:
World Bank, International Debt Statistics.
Categories, topics:
Economy & Growth, External Debt
Last updated:
apr 23, 2017
Indicators value changes by year
Minimum:
51.062
jan 1, 2014
Maximum:
760.436
jan 1, 1987
At the date of observation
Value
Absolute change
Change from previous value
jan 1, 1979
270.856
+270.856
0.0%
jan 1, 1980
198.113
-72.742
-26.86%
jan 1, 1981
200.171
+2.057
1.04%
jan 1, 1982
308.703
+108.533
54.22%
jan 1, 1983
339.506
+30.803
9.98%
jan 1, 1984
365.547
+26.04
7.67%
jan 1, 1985
385.632
+20.085
5.49%
jan 1, 1986
517.193
+131.561
34.12%
jan 1, 1987
760.436
+243.243
47.03%
jan 1, 1988
719.32
-41.116
-5.41%
jan 1, 1989
535.19
-184.13
-25.6%
jan 1, 1990
459.406
-75.783
-14.16%
jan 1, 1991
506.999
+47.593
10.36%
jan 1, 1992
549.861
+42.862
8.45%
jan 1, 1998
524.81
-25.051
-4.56%
jan 1, 1999
712.479
+187.669
35.76%
jan 1, 2000
645.317
-67.162
-9.43%
jan 1, 2001
651.971
+6.654
1.03%
jan 1, 2002
575.138
-76.833
-11.78%
jan 1, 2003
582.397
+7.259
1.26%
jan 1, 2004
535.584
-46.812
-8.04%
jan 1, 2005
357.644
-177.94
-33.22%
jan 1, 2006
192.173
-165.472
-46.27%
jan 1, 2007
52.019
-140.153
-72.93%
jan 1, 2008
54.294
+2.275
4.37%
jan 1, 2009
54.399
+0.106
0.19%
jan 1, 2010
76.935
+22.535
41.43%
jan 1, 2011
54.376
-22.558
-29.32%
jan 1, 2012
54.073
-0.304
-0.56%
jan 1, 2013
55.594
+1.521
2.81%
jan 1, 2014
51.062
-4.532
-8.15%
jan 1, 2015
68.068
+17.006
33.31%
jan 1, 2016
106.724
+38.655
56.79%
Ranking of countries by current statistics by years


Comments: