29
/
en
AIzaSyAYiBZKx7MnpbEhh9jyipgxe19OcubqV5w
April 1, 2024
243555
Solomon Islands
SLB
true
2
1
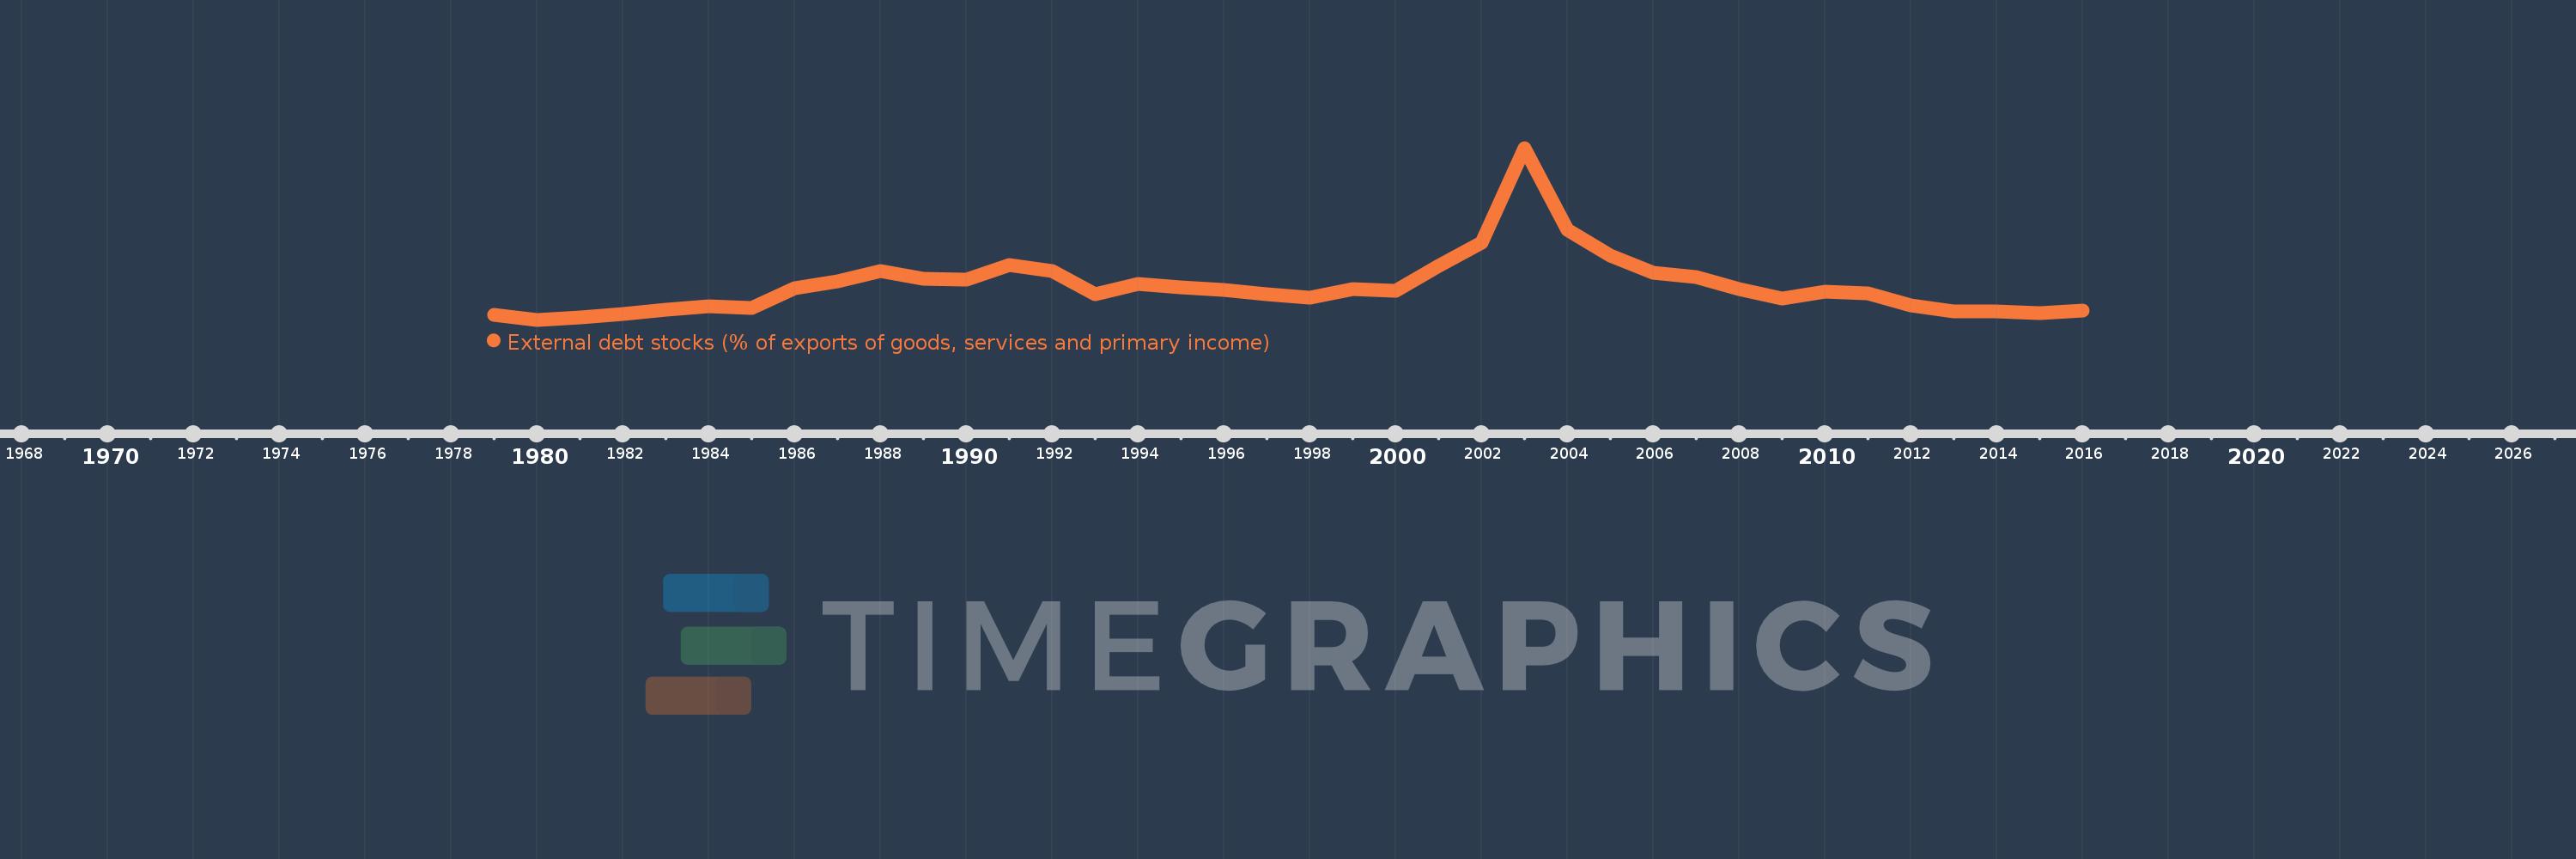
External debt stocks (% of exports of goods, services and primary income)
2016,2015,2014,2013,2012,2011,2010,2009,2008,2007,2006,2005,2004,2003,2002,2001,2000,1999,1998,1997,1996,1995,1994,1993,1992,1991,1990,1989,1988,1987,1986,1985,1984,1983,1982,1981,1980,1979
This statistics in other country:
Timeline:
This timeline shows a graph from 1979 to 2016 of Solomon Islands. No data until 1978. Number of actual observations by date: 38.
Source name:
World Development Indicators
Source organization:
World Bank, International Debt Statistics.
Categories, topics:
Economy & Growth, External Debt
Last updated:
apr 23, 2017
Indicators value changes by year
Minimum:
18.534
jan 1, 1980
Maximum:
346.553
jan 1, 2003
At the date of observation
Value
Absolute change
Change from previous value
jan 1, 1979
28.491
+28.491
0.0%
jan 1, 1980
18.534
-9.957
-34.95%
jan 1, 1981
22.834
+4.3
23.2%
jan 1, 1982
29.573
+6.739
29.51%
jan 1, 1983
37.698
+8.125
27.48%
jan 1, 1984
43.492
+5.794
15.37%
jan 1, 1985
40.915
-2.577
-5.93%
jan 1, 1986
78.08
+37.165
90.84%
jan 1, 1987
91.632
+13.551
17.36%
jan 1, 1988
111.423
+19.792
21.6%
jan 1, 1989
96.46
-14.963
-13.43%
jan 1, 1990
95.138
-1.322
-1.37%
jan 1, 1991
123.217
+28.079
29.51%
jan 1, 1992
111.224
-11.993
-9.73%
jan 1, 1993
67.954
-43.27
-38.9%
jan 1, 1994
87.428
+19.475
28.66%
jan 1, 1995
80.014
-7.415
-8.48%
jan 1, 1996
75.122
-4.891
-6.11%
jan 1, 1997
67.97
-7.152
-9.52%
jan 1, 1998
60.982
-6.988
-10.28%
jan 1, 1999
77.674
+16.692
27.37%
jan 1, 2000
73.295
-4.379
-5.64%
jan 1, 2001
121.307
+48.012
65.51%
jan 1, 2002
166.081
+44.774
36.91%
jan 1, 2003
346.553
+180.472
108.67%
jan 1, 2004
189.952
-156.602
-45.19%
jan 1, 2005
141.496
-48.455
-25.51%
jan 1, 2006
108.08
-33.416
-23.62%
jan 1, 2007
99.586
-8.494
-7.86%
jan 1, 2008
76.563
-23.024
-23.12%
jan 1, 2009
59.657
-16.905
-22.08%
jan 1, 2010
72.661
+13.004
21.8%
jan 1, 2011
68.928
-3.733
-5.14%
jan 1, 2012
45.489
-23.439
-34.0%
jan 1, 2013
34.978
-10.511
-23.11%
jan 1, 2014
33.724
-1.254
-3.59%
jan 1, 2015
30.538
-3.186
-9.45%
jan 1, 2016
35.92
+5.382
17.62%
Ranking of countries by current statistics by years


Comments: