29
/
en
AIzaSyAYiBZKx7MnpbEhh9jyipgxe19OcubqV5w
April 1, 2024
48950
Middle East & North Africa (excluding high income)
MNA
false
2
1
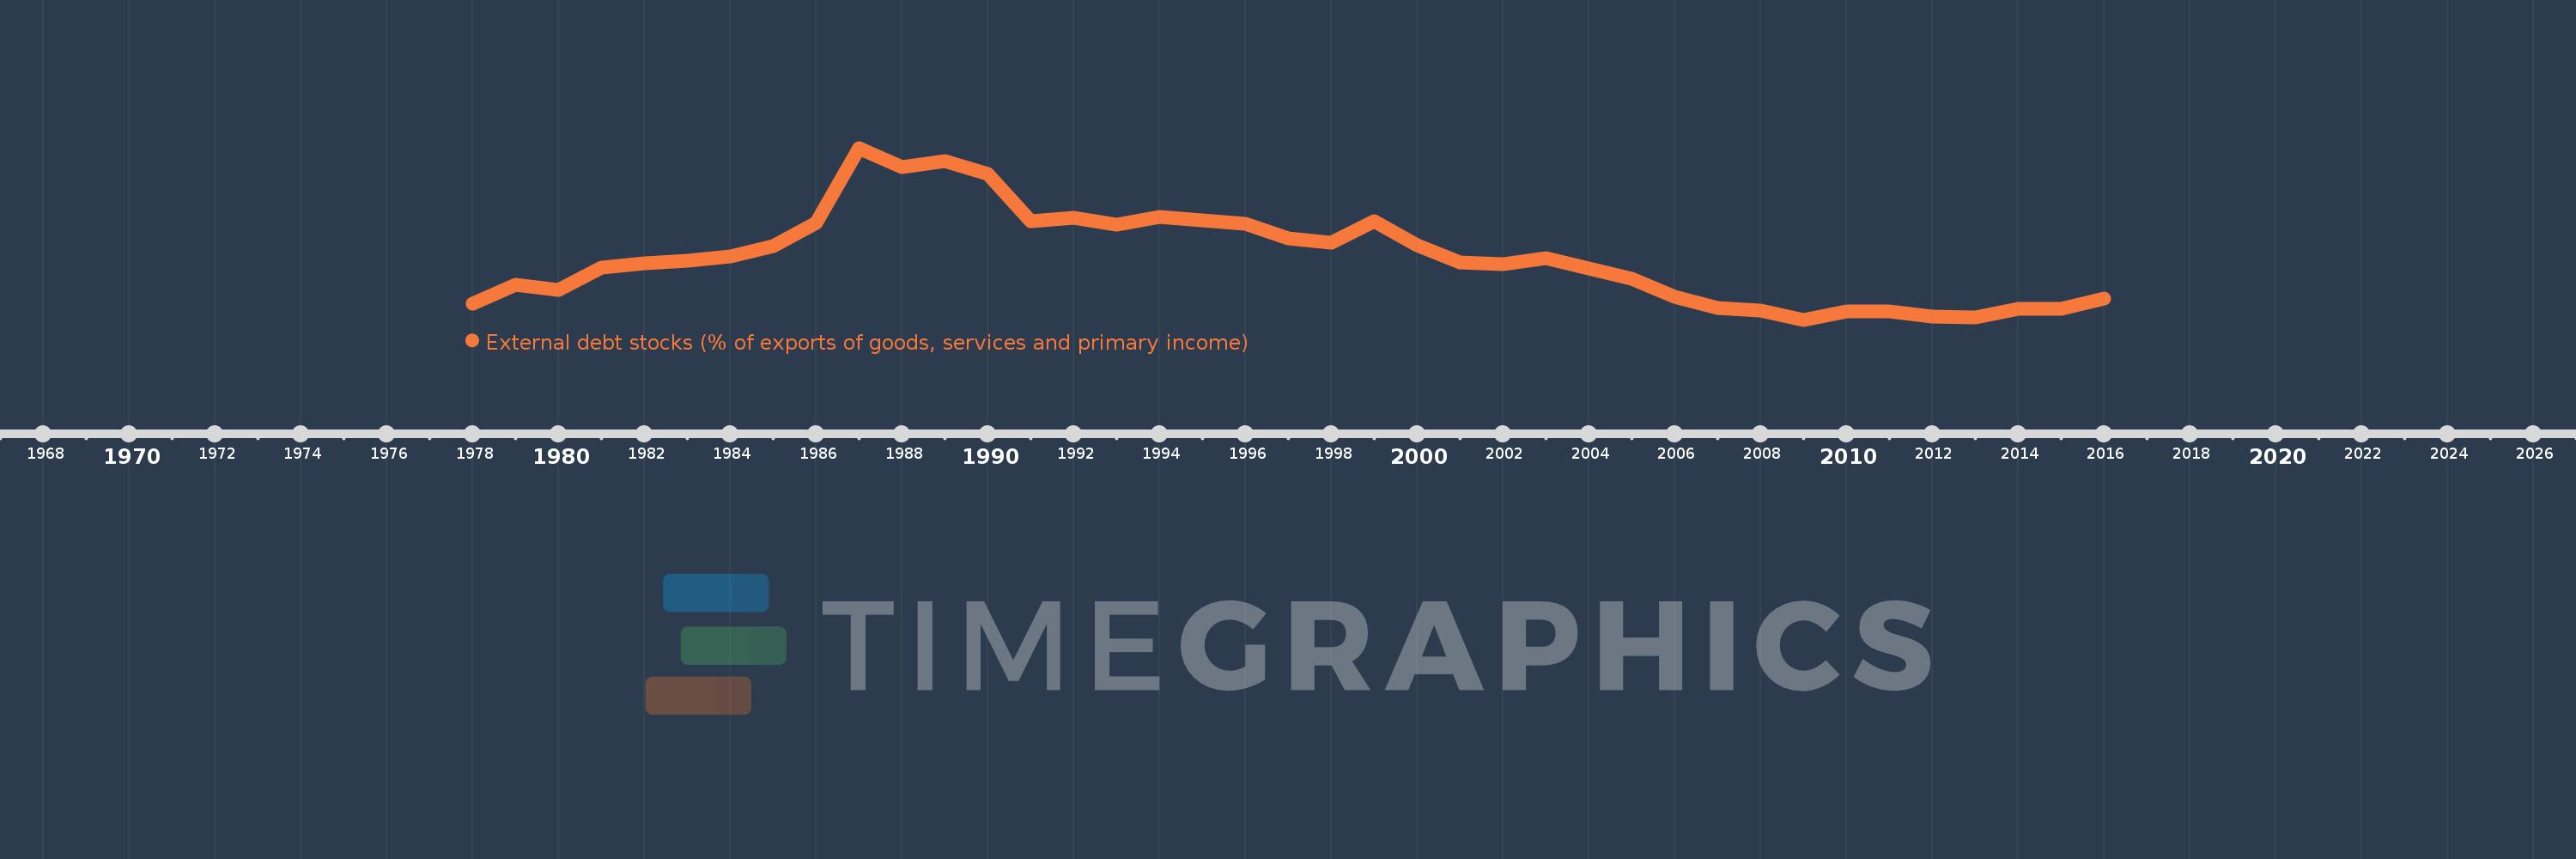
External debt stocks (% of exports of goods, services and primary income)
2016,2015,2014,2013,2012,2011,2010,2009,2008,2007,2006,2005,2004,2003,2002,2001,2000,1999,1998,1997,1996,1995,1994,1993,1992,1991,1990,1989,1988,1987,1986,1985,1984,1983,1982,1981,1980,1979,1978
This statistics in other country:
Timeline:
This timeline shows a graph from 1978 to 2016 of Middle East & North Africa (excluding high income). No data until 1977. Number of actual observations by date: 39.
Source name:
World Development Indicators
Source organization:
World Bank, International Debt Statistics.
Categories, topics:
Economy & Growth, External Debt
Last updated:
apr 23, 2017
Indicators value changes by year
Minimum:
39.256
jan 1, 2009
Maximum:
288.506
jan 1, 1987
At the date of observation
Value
Absolute change
Change from previous value
jan 1, 1978
62.061
+62.061
0.0%
jan 1, 1979
90.561
+28.5
45.92%
jan 1, 1980
82.116
-8.445
-9.33%
jan 1, 1981
115.471
+33.355
40.62%
jan 1, 1982
121.423
+5.952
5.15%
jan 1, 1983
124.516
+3.093
2.55%
jan 1, 1984
131.404
+6.887
5.53%
jan 1, 1985
145.523
+14.119
10.74%
jan 1, 1986
179.452
+33.93
23.32%
jan 1, 1987
288.506
+109.054
60.77%
jan 1, 1988
260.802
-27.704
-9.6%
jan 1, 1989
269.207
+8.405
3.22%
jan 1, 1990
250.195
-19.012
-7.06%
jan 1, 1991
182.533
-67.662
-27.04%
jan 1, 1992
187.384
+4.851
2.66%
jan 1, 1993
177.305
-10.079
-5.38%
jan 1, 1994
188.694
+11.389
6.42%
jan 1, 1995
183.989
-4.705
-2.49%
jan 1, 1996
178.863
-5.126
-2.79%
jan 1, 1997
156.853
-22.01
-12.31%
jan 1, 1998
151.517
-5.336
-3.4%
jan 1, 1999
181.856
+30.339
20.02%
jan 1, 2000
147.003
-34.853
-19.17%
jan 1, 2001
122.865
-24.138
-16.42%
jan 1, 2002
119.901
-2.964
-2.41%
jan 1, 2003
129.145
+9.244
7.71%
jan 1, 2004
113.486
-15.658
-12.12%
jan 1, 2005
99.125
-14.361
-12.65%
jan 1, 2006
72.752
-26.373
-26.61%
jan 1, 2007
56.613
-16.139
-22.18%
jan 1, 2008
52.415
-4.198
-7.42%
jan 1, 2009
39.256
-13.159
-25.11%
jan 1, 2010
51.137
+11.881
30.27%
jan 1, 2011
51.127
-0.01
-0.02%
jan 1, 2012
43.331
-7.796
-15.25%
jan 1, 2013
42.019
-1.312
-3.03%
jan 1, 2014
54.56
+12.541
29.85%
jan 1, 2015
54.823
+0.264
0.48%
jan 1, 2016
69.47
+14.647
26.72%
Ranking of countries by current statistics by years


Comments: