29
/
en
AIzaSyAYiBZKx7MnpbEhh9jyipgxe19OcubqV5w
April 1, 2024
89515
Botswana
BWA
true
2
1
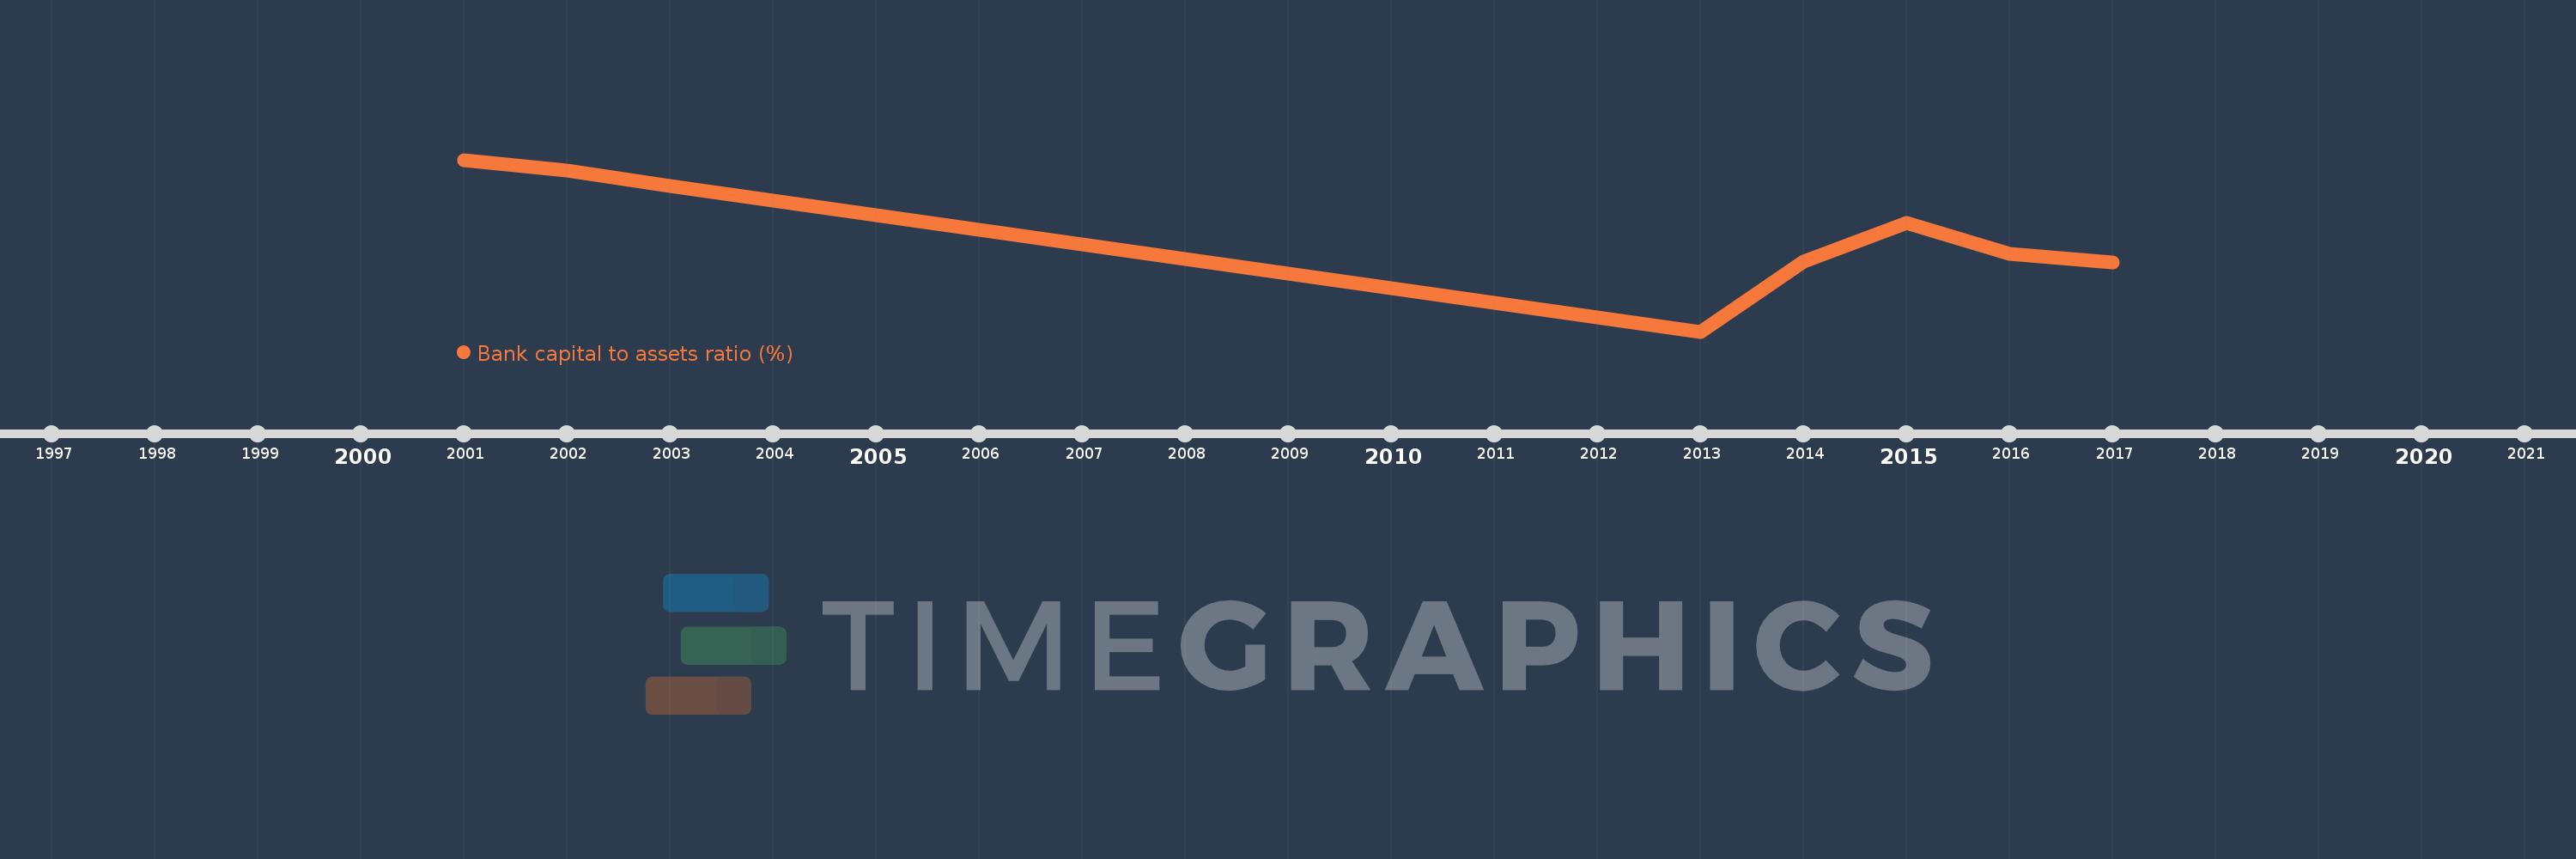
Bank capital to assets ratio (%)
2017,2016,2015,2014,2013,2003,2002,2001
This statistics in other country:
Timeline:
This timeline shows a graph from 2001 to 2017 of Botswana. No data until 2000. Number of actual observations by date: 8.
Source name:
World Development Indicators
Source organization:
International Monetary Fund, Global Financial Stability Report.
Categories, topics:
Financial Sector
Last updated:
apr 23, 2017
Indicators value changes by year
At the date of observation
Value
Absolute change
Change from previous value
jan 1, 2001
10.3
+10.3
0.0%
jan 1, 2002
10.1
-0.2
-1.94%
jan 1, 2003
9.8
-0.3
-2.97%
jan 1, 2013
7.061
-2.739
-27.95%
jan 1, 2014
8.383
+1.322
18.72%
jan 1, 2015
9.111
+0.729
8.69%
jan 1, 2016
8.524
-0.587
-6.44%
jan 1, 2017
8.369
-0.156
-1.83%
Ranking of countries by current statistics by years


Comments: