29
/
en
AIzaSyAYiBZKx7MnpbEhh9jyipgxe19OcubqV5w
April 1, 2024
170687
Kosovo
XKX
true
2
1
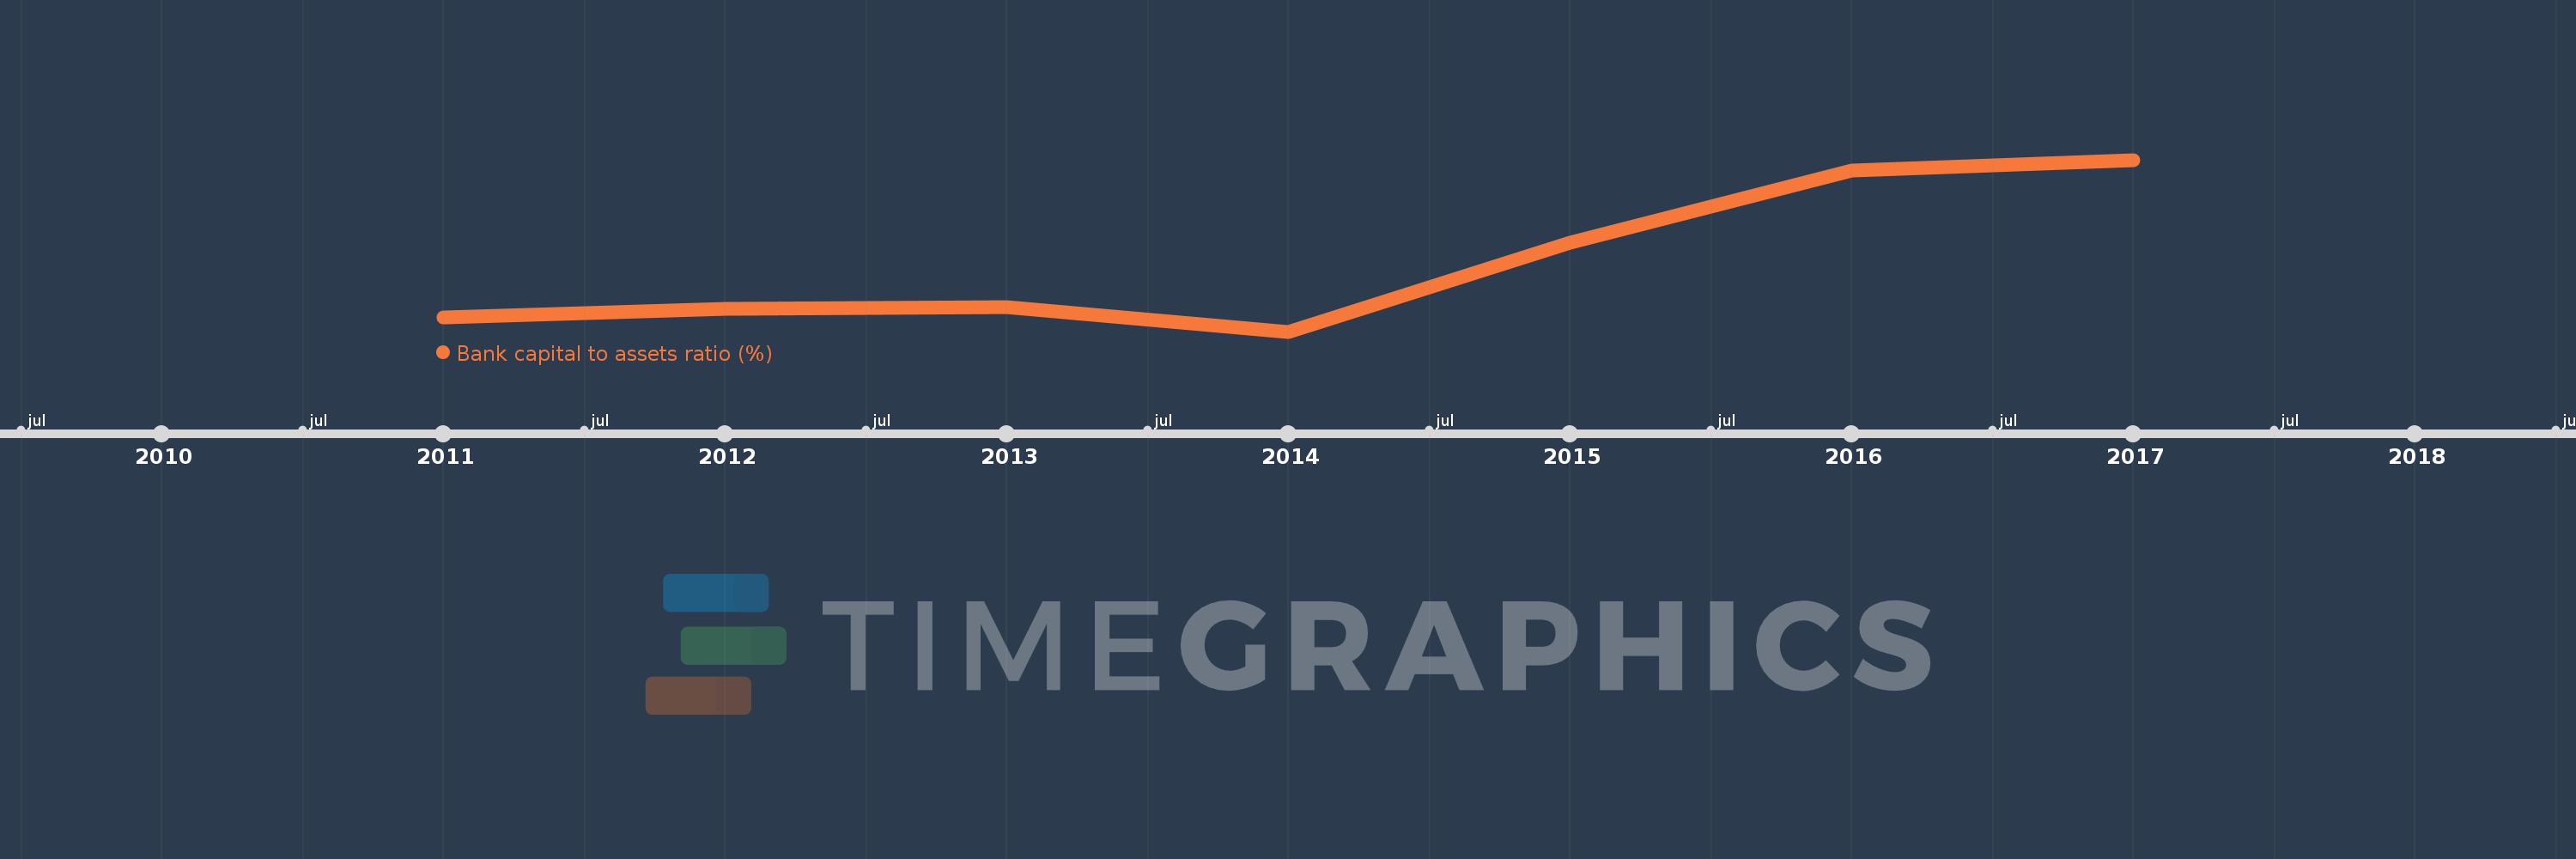
Bank capital to assets ratio (%)
2017,2016,2015,2014,2013,2012,2011
This statistics in other country:
Timeline:
This timeline shows a graph from 2011 to 2017 of Kosovo. No data until 2010. Number of actual observations by date: 7.
Source name:
World Development Indicators
Source organization:
International Monetary Fund, Global Financial Stability Report.
Categories, topics:
Financial Sector
Last updated:
apr 23, 2017
Indicators value changes by year
Maximum:
12.447
jan 1, 2017
At the date of observation
Value
Absolute change
Change from previous value
jan 1, 2011
9.385
+9.385
0.0%
jan 1, 2012
9.542
+0.157
1.68%
jan 1, 2013
9.587
+0.045
0.47%
jan 1, 2014
9.102
-0.486
-5.06%
jan 1, 2015
10.83
+1.728
18.98%
jan 1, 2016
12.23
+1.4
12.93%
jan 1, 2017
12.447
+0.217
1.77%
Ranking of countries by current statistics by years


Comments: