29
/
en
AIzaSyAYiBZKx7MnpbEhh9jyipgxe19OcubqV5w
April 1, 2024
232968
San Marino
SMR
true
2
1
Bank capital to assets ratio (%)
2017,2016,2015,2014,2013,2012,2011,2010
This statistics in other country:
Timeline:
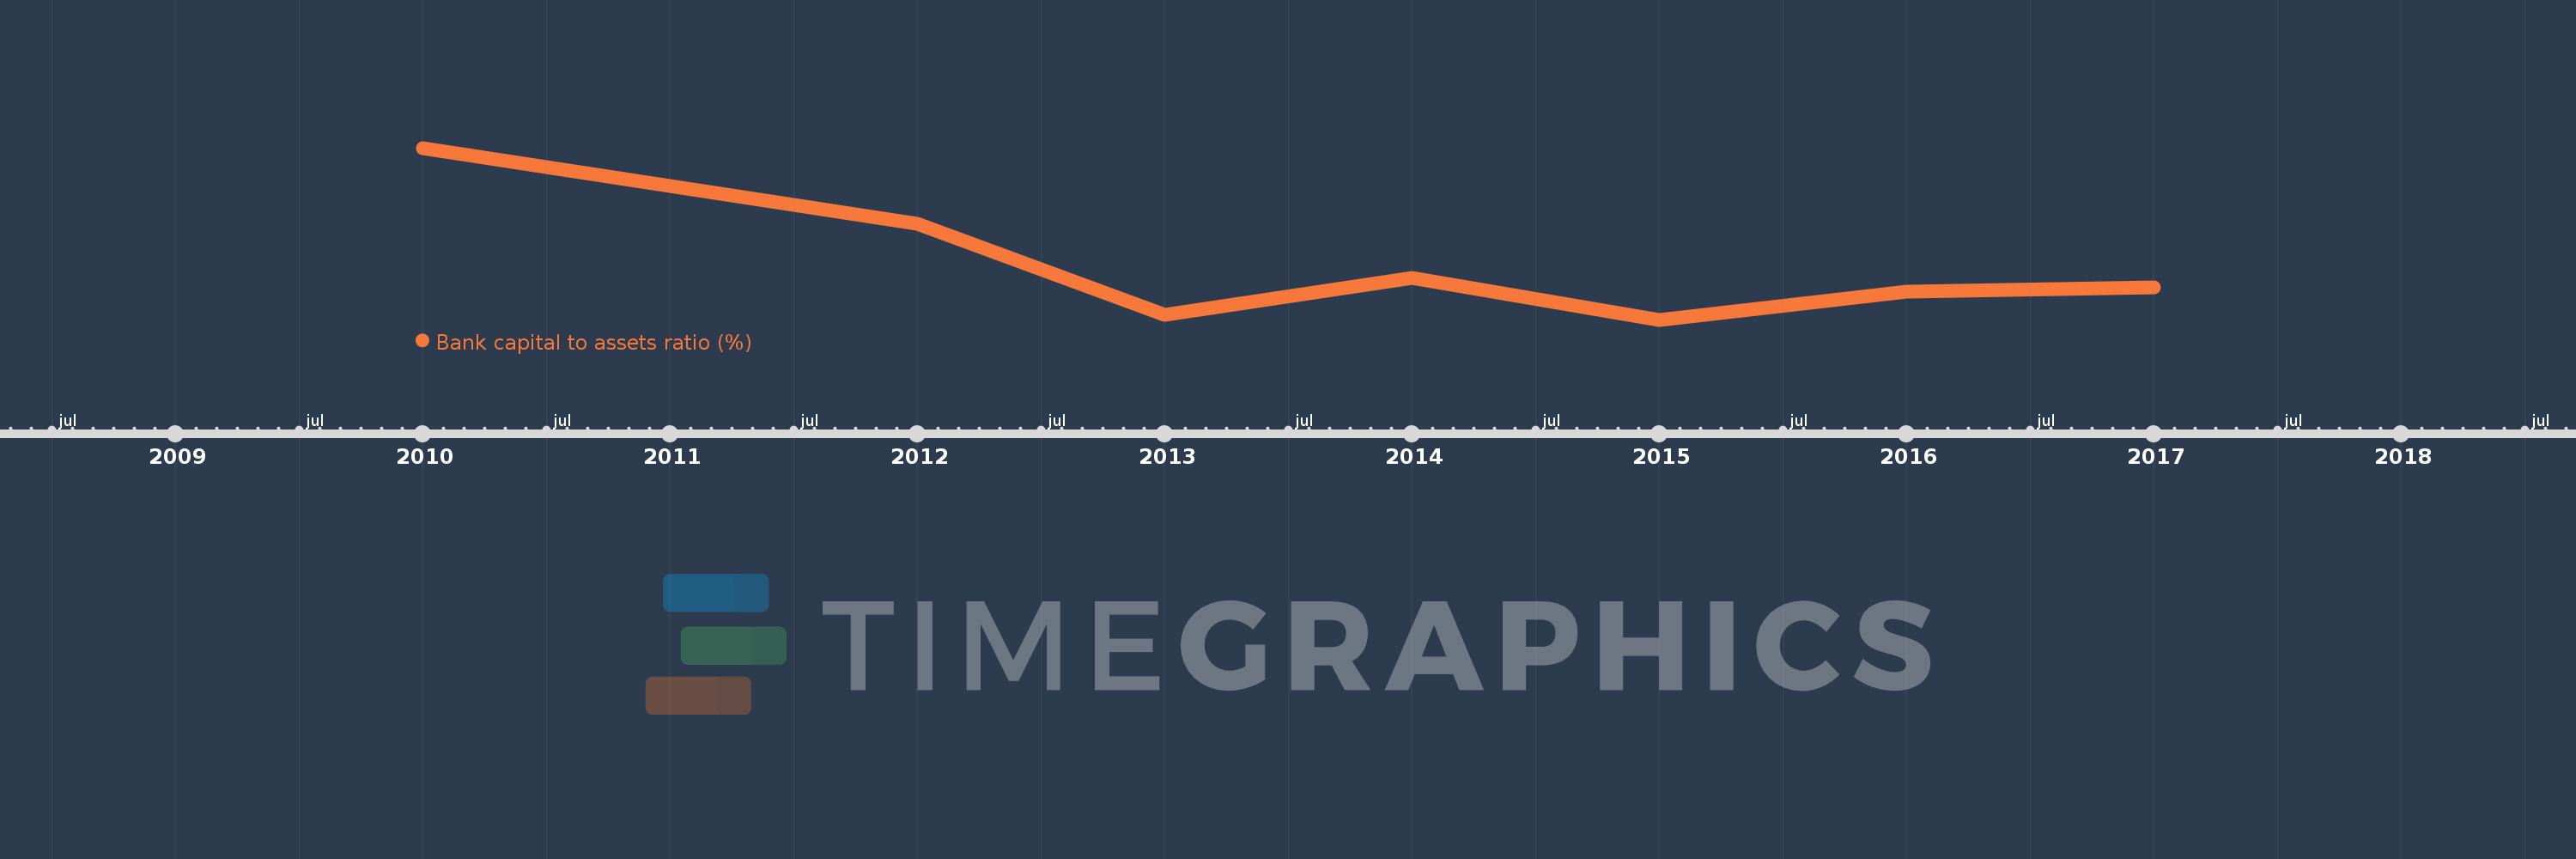
This timeline shows a graph from 2010 to 2017 of San Marino. No data until 2009. Number of actual observations by date: 8.
Source name:
World Development Indicators
Source organization:
International Monetary Fund, Global Financial Stability Report.
Categories, topics:
Financial Sector
Last updated:
apr 23, 2017
Indicators value changes by year
Maximum:
10.566
jan 1, 2010
At the date of observation
Value
Absolute change
Change from previous value
jan 1, 2010
10.566
+10.566
0.0%
jan 1, 2011
9.607
-0.96
-9.08%
jan 1, 2012
8.641
-0.966
-10.06%
jan 1, 2013
6.343
-2.297
-26.59%
jan 1, 2014
7.275
+0.932
14.69%
jan 1, 2015
6.217
-1.058
-14.55%
jan 1, 2016
6.928
+0.711
11.44%
jan 1, 2017
7.044
+0.116
1.67%
Ranking of countries by current statistics by years


Comments: