29
/
en
AIzaSyAYiBZKx7MnpbEhh9jyipgxe19OcubqV5w
April 1, 2024
245256
South Africa
ZAF
true
2
1
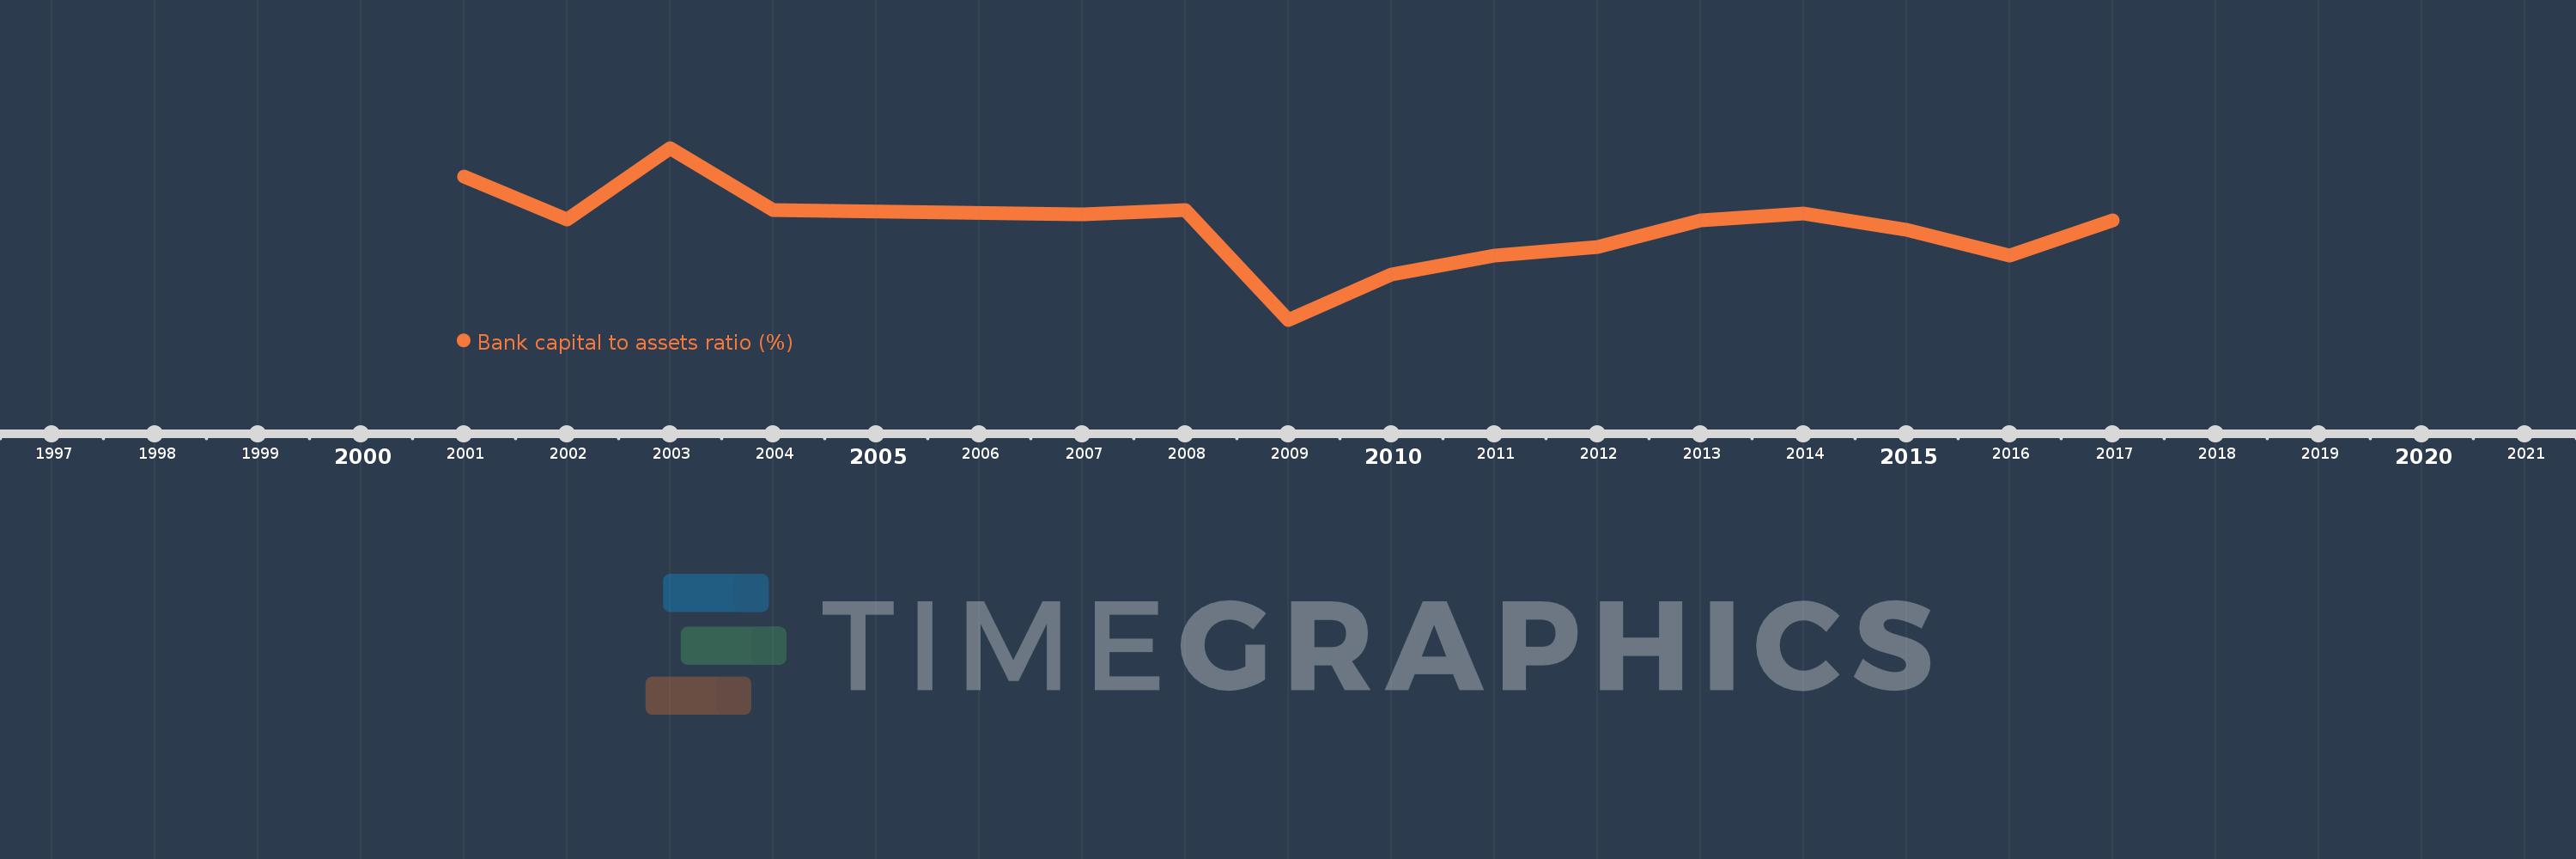
Bank capital to assets ratio (%)
2017,2016,2015,2014,2013,2012,2011,2010,2009,2008,2007,2004,2003,2002,2001
This statistics in other country:
Timeline:
This timeline shows a graph from 2001 to 2017 of South Africa. No data until 2000. Number of actual observations by date: 15.
Source name:
World Development Indicators
Source organization:
International Monetary Fund, Global Financial Stability Report.
Categories, topics:
Financial Sector
Last updated:
apr 23, 2017
Indicators value changes by year
At the date of observation
Value
Absolute change
Change from previous value
jan 1, 2002
7.8
-0.9
-10.34%
jan 1, 2003
9.3
+1.5
19.23%
jan 1, 2004
8.0
-1.3
-13.98%
jan 1, 2007
7.9
-0.1
-1.25%
jan 1, 2008
8.0
+0.1
1.27%
jan 1, 2009
5.7
-2.3
-28.75%
jan 1, 2010
6.655
+0.955
16.75%
jan 1, 2011
7.046
+0.391
5.88%
jan 1, 2012
7.227
+0.181
2.57%
jan 1, 2013
7.789
+0.562
7.78%
jan 1, 2014
7.92
+0.131
1.68%
jan 1, 2015
7.577
-0.343
-4.33%
jan 1, 2016
7.038
-0.54
-7.12%
jan 1, 2017
7.787
+0.749
10.65%
Ranking of countries by current statistics by years


Comments: