29
/
en
AIzaSyAYiBZKx7MnpbEhh9jyipgxe19OcubqV5w
April 1, 2024
33250
European Union
EUU
false
2
1
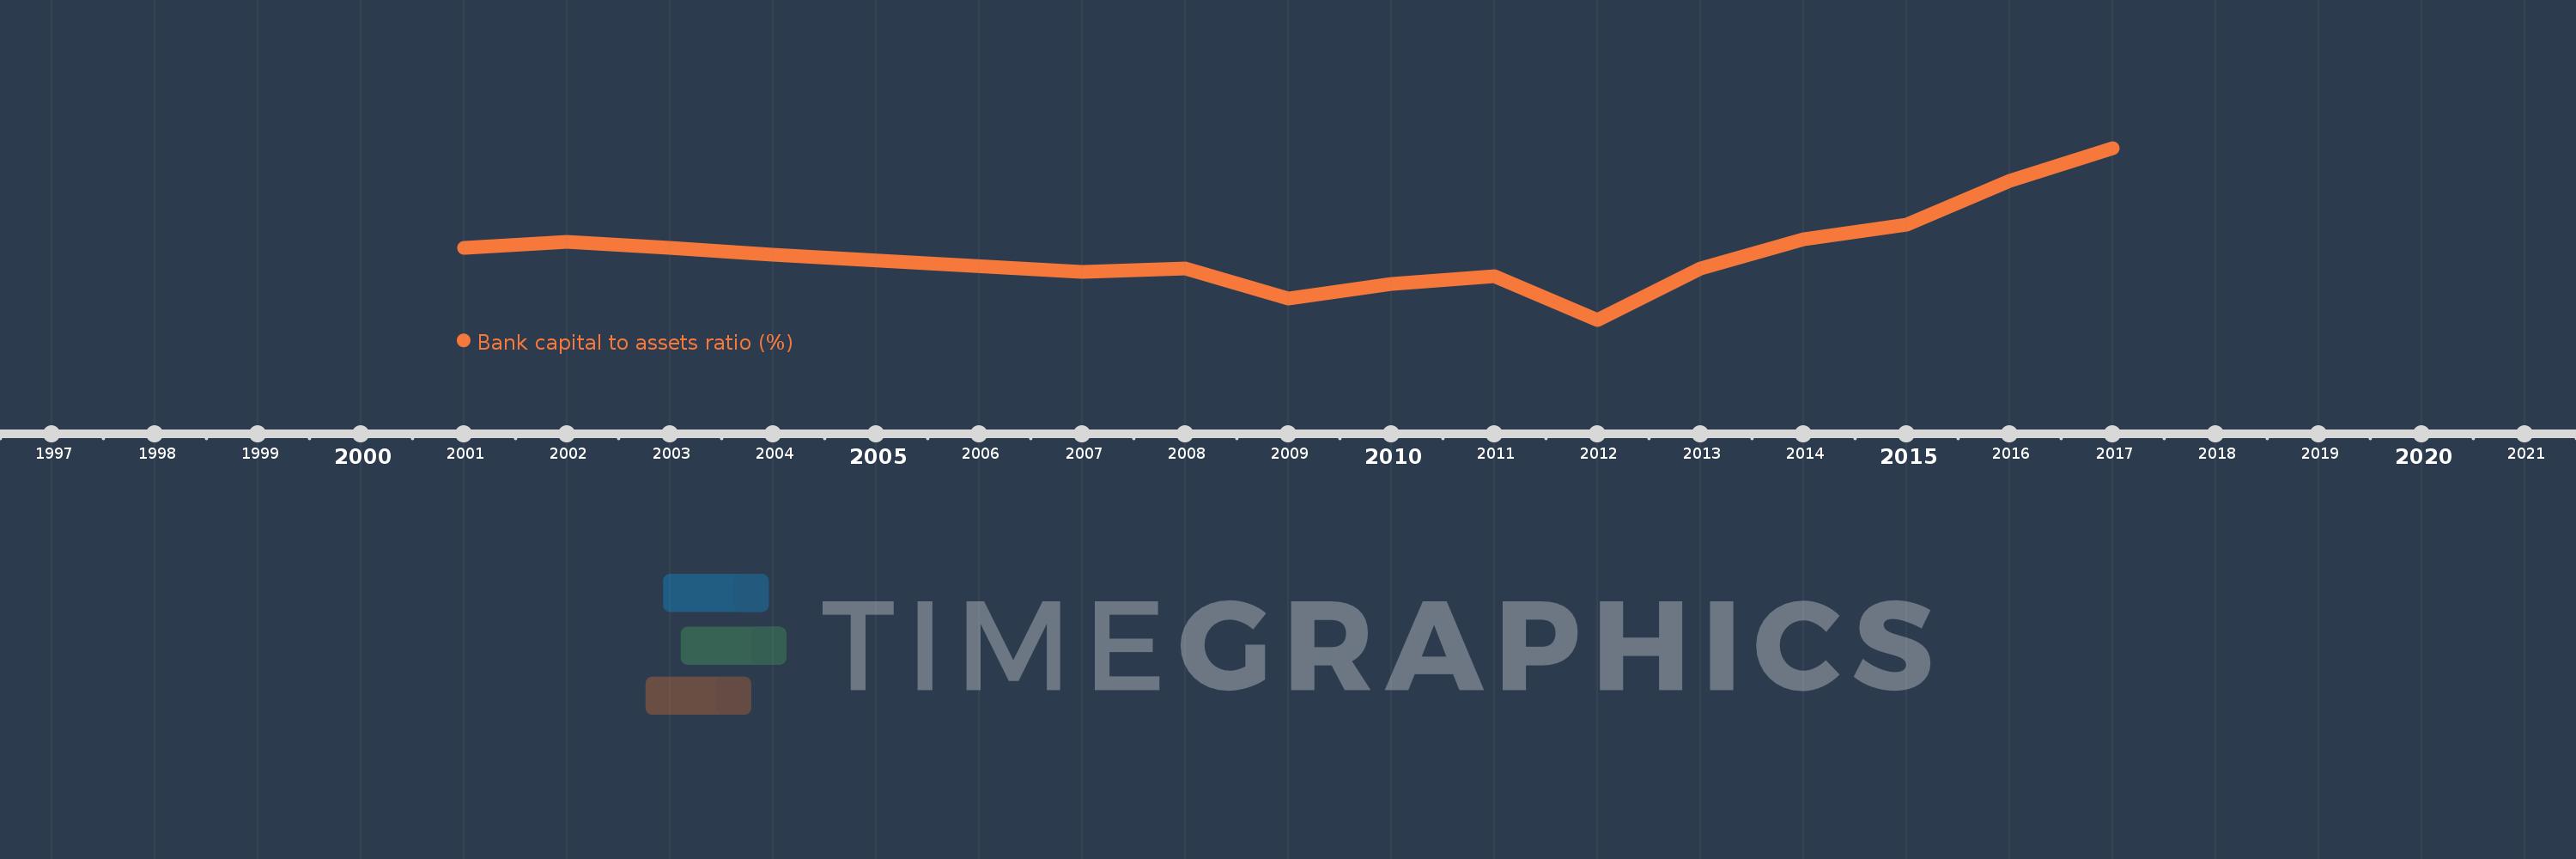
Bank capital to assets ratio (%)
2017,2016,2015,2014,2013,2012,2011,2010,2009,2008,2007,2004,2003,2002,2001
This statistics in other country:
Timeline:
This timeline shows a graph from 2001 to 2017 of European Union. No data until 2000. Number of actual observations by date: 15.
Source name:
World Development Indicators
Source organization:
International Monetary Fund, Global Financial Stability Report.
Categories, topics:
Financial Sector
Last updated:
apr 23, 2017
Indicators value changes by year
At the date of observation
Value
Absolute change
Change from previous value
jan 1, 2002
7.1
+0.1
1.43%
jan 1, 2003
7.0
-0.1
-1.41%
jan 1, 2004
6.9
-0.1
-1.43%
jan 1, 2007
6.641
-0.259
-3.76%
jan 1, 2008
6.7
+0.059
0.89%
jan 1, 2009
6.242
-0.458
-6.84%
jan 1, 2010
6.456
+0.214
3.43%
jan 1, 2011
6.576
+0.12
1.86%
jan 1, 2012
5.924
-0.652
-9.91%
jan 1, 2013
6.701
+0.777
13.12%
jan 1, 2014
7.135
+0.434
6.48%
jan 1, 2015
7.348
+0.213
2.99%
jan 1, 2016
8.007
+0.659
8.97%
jan 1, 2017
8.506
+0.499
6.23%
Ranking of countries by current statistics by years


Comments: