29
/
en
AIzaSyAYiBZKx7MnpbEhh9jyipgxe19OcubqV5w
April 1, 2024
50673
Middle income
MIC
false
2
1
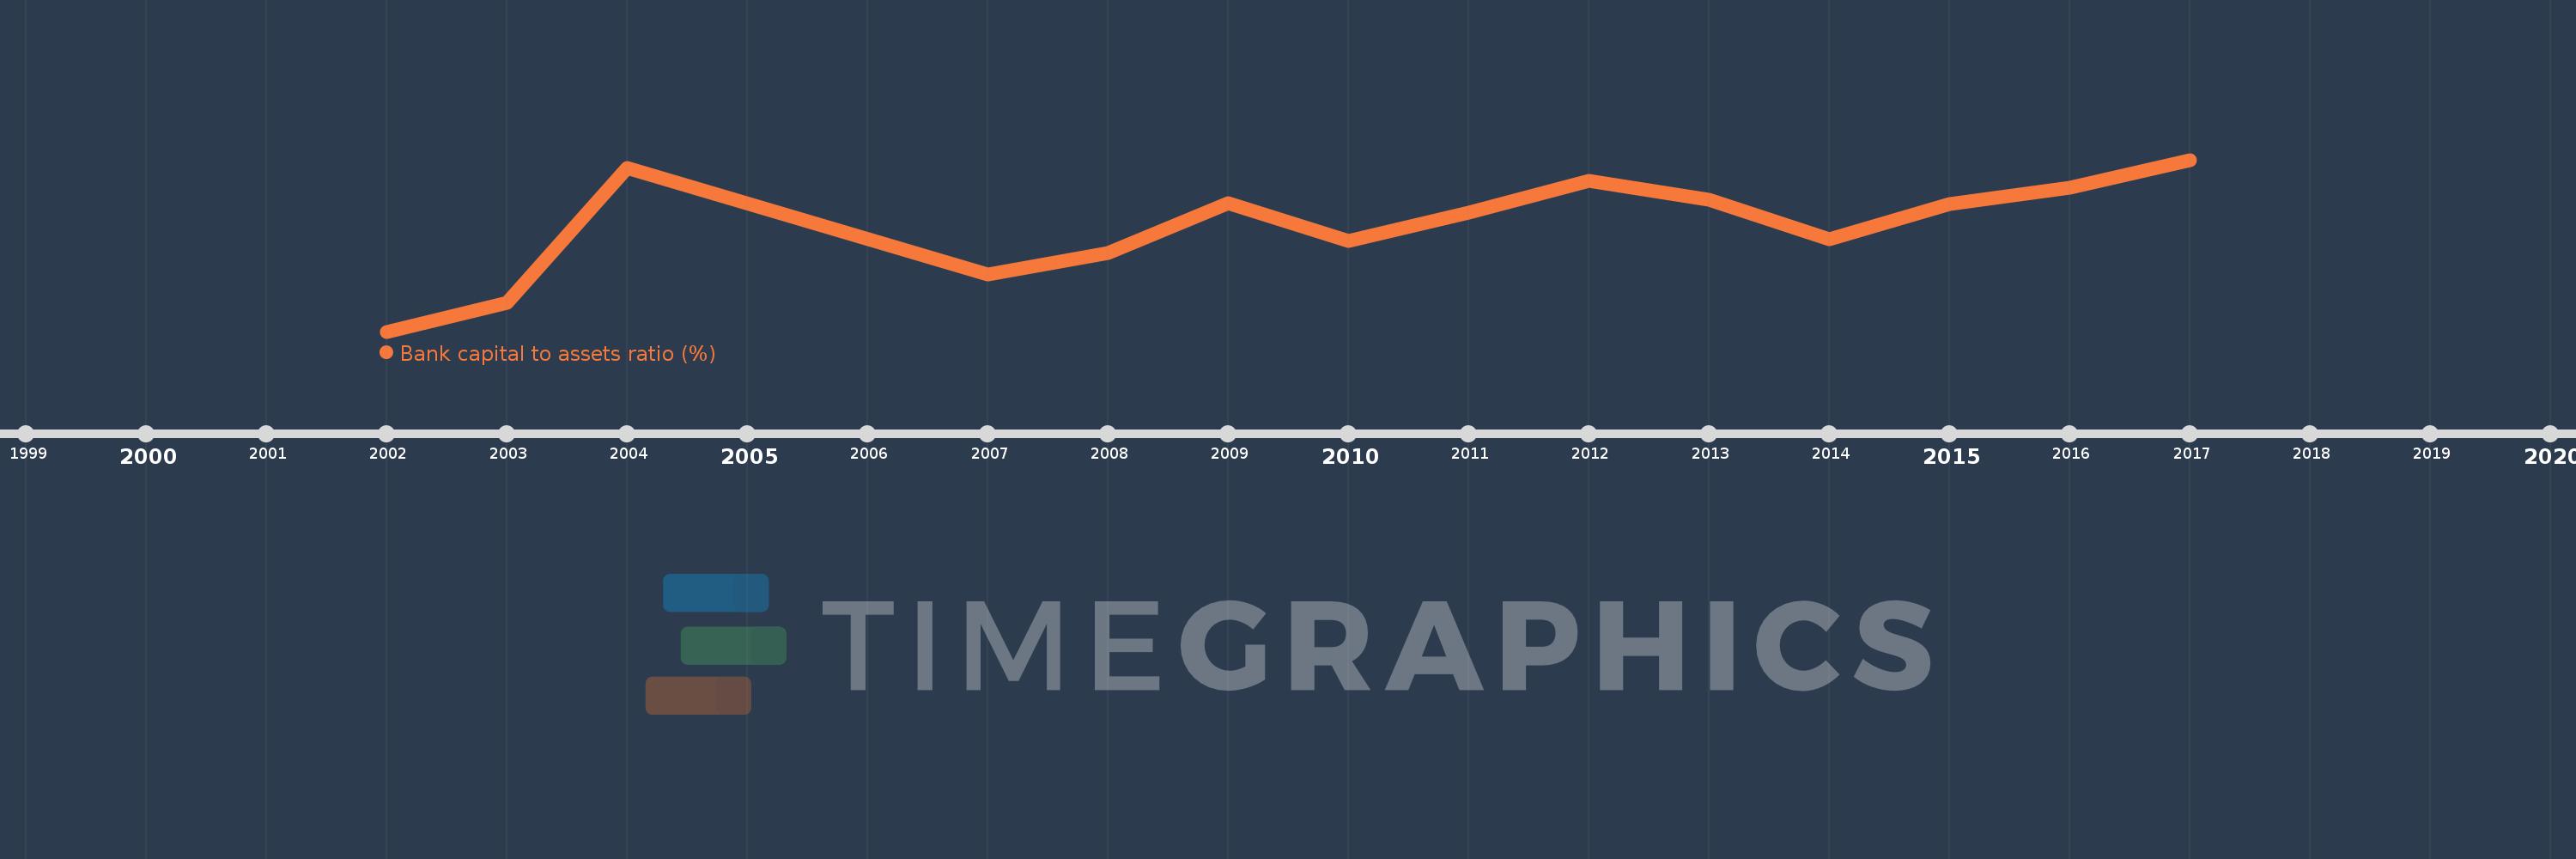
Bank capital to assets ratio (%)
2017,2016,2015,2014,2013,2012,2011,2010,2009,2008,2007,2004,2003,2002
This statistics in other country:
Timeline:
This timeline shows a graph from 2002 to 2017 of Middle income. No data until 2001. Number of actual observations by date: 14.
Source name:
World Development Indicators
Source organization:
International Monetary Fund, Global Financial Stability Report.
Categories, topics:
Financial Sector
Last updated:
apr 23, 2017
Indicators value changes by year
Maximum:
10.705
jan 1, 2017
At the date of observation
Value
Absolute change
Change from previous value
jan 1, 2003
9.7
+0.2
2.11%
jan 1, 2004
10.65
+0.95
9.79%
jan 1, 2007
9.9
-0.75
-7.04%
jan 1, 2008
10.05
+0.15
1.52%
jan 1, 2009
10.4
+0.35
3.48%
jan 1, 2010
10.133
-0.267
-2.56%
jan 1, 2011
10.333
+0.199
1.97%
jan 1, 2012
10.56
+0.228
2.2%
jan 1, 2013
10.424
-0.136
-1.29%
jan 1, 2014
10.147
-0.278
-2.66%
jan 1, 2015
10.393
+0.246
2.42%
jan 1, 2016
10.507
+0.114
1.1%
jan 1, 2017
10.705
+0.198
1.88%
Ranking of countries by current statistics by years


Comments: