29
/
en
AIzaSyAYiBZKx7MnpbEhh9jyipgxe19OcubqV5w
April 1, 2024
125836
El Salvador
SLV
true
2
1
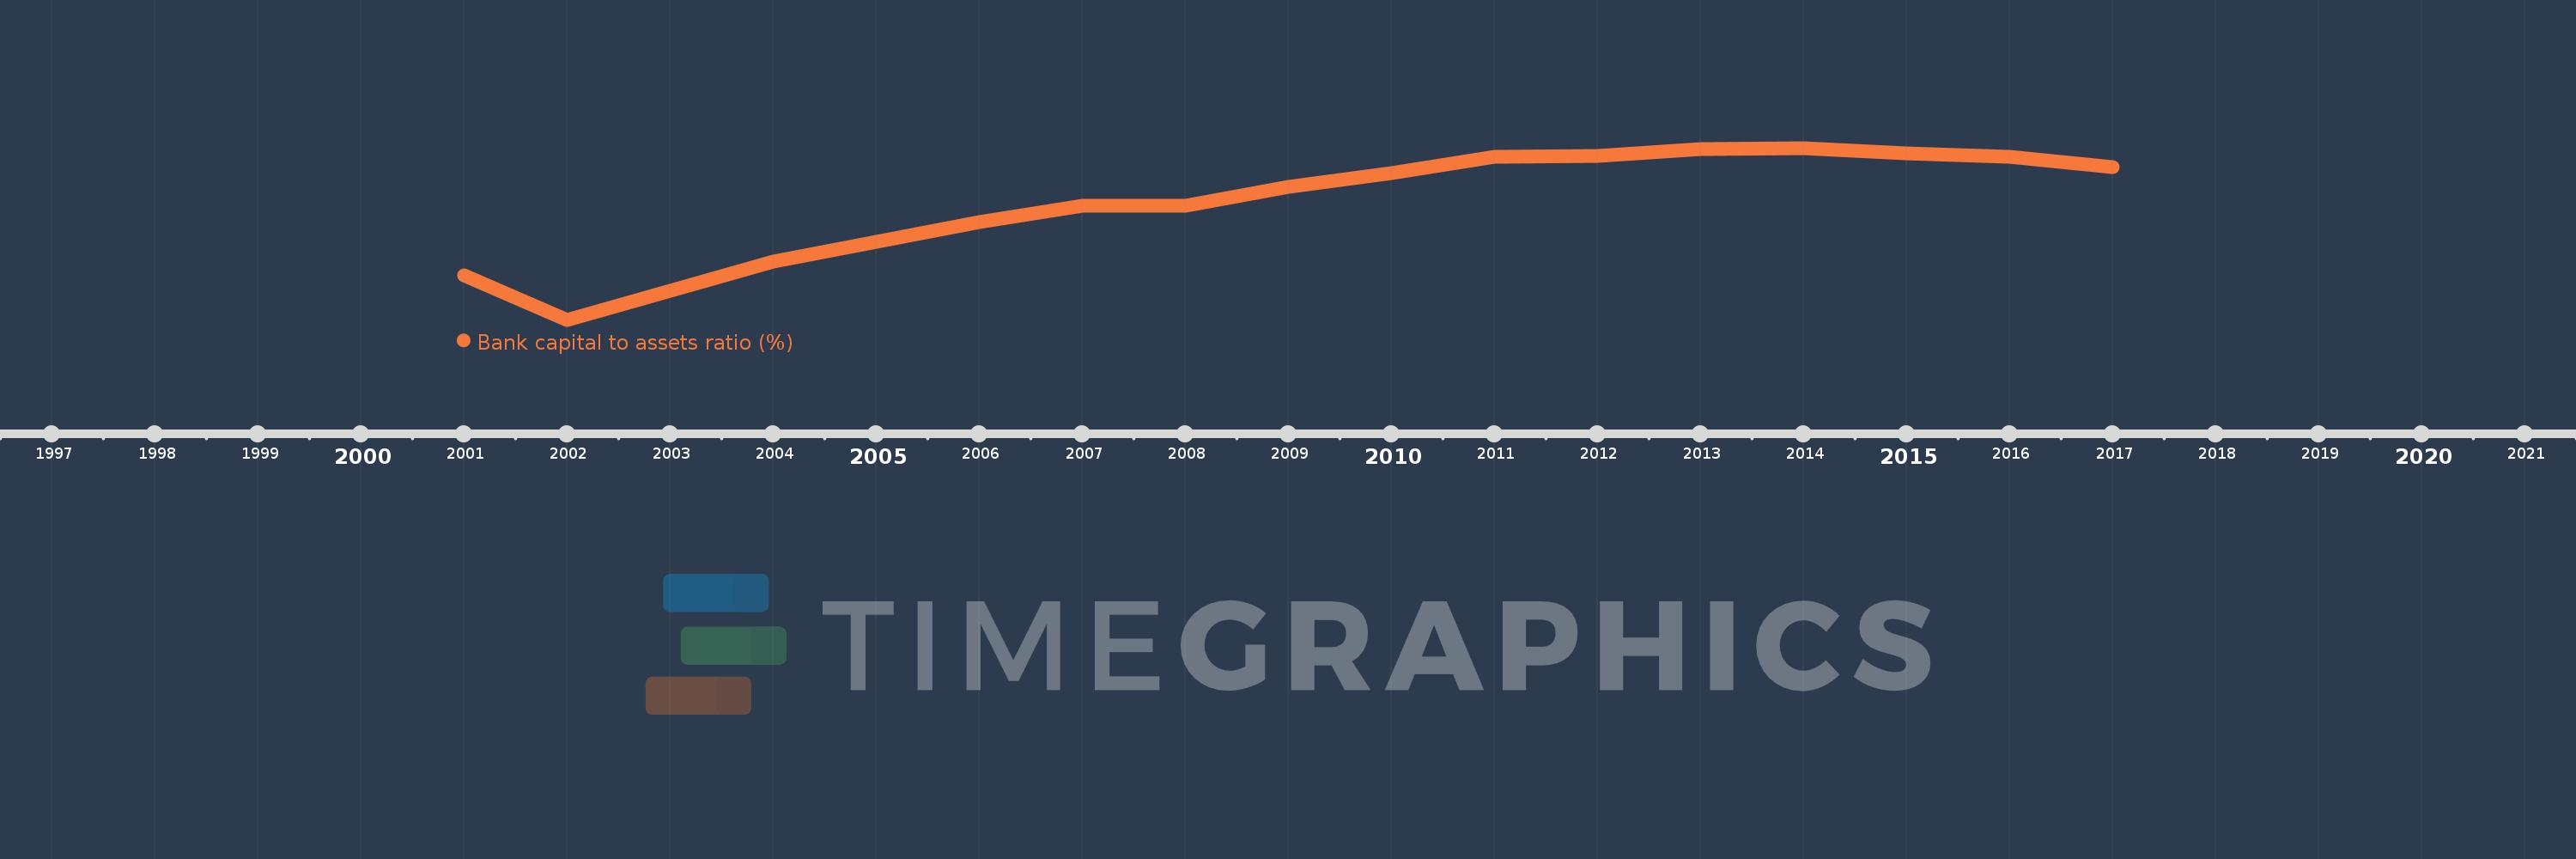
Bank capital to assets ratio (%)
2017,2016,2015,2014,2013,2012,2011,2010,2009,2008,2007,2006,2004,2002,2001
This statistics in other country:
Timeline:
This timeline shows a graph from 2001 to 2017 of El Salvador. No data until 2000. Number of actual observations by date: 15.
Source name:
World Development Indicators
Source organization:
International Monetary Fund, Global Financial Stability Report.
Categories, topics:
Financial Sector
Last updated:
apr 23, 2017
Indicators value changes by year
Maximum:
14.271
jan 1, 2014
At the date of observation
Value
Absolute change
Change from previous value
jan 1, 2002
6.9
-1.9
-21.59%
jan 1, 2004
9.4
+2.5
36.23%
jan 1, 2006
11.1
+1.7
18.09%
jan 1, 2007
11.8
+0.7
6.31%
jan 1, 2009
12.6
+0.8
6.78%
jan 1, 2010
13.182
+0.582
4.62%
jan 1, 2011
13.9
+0.718
5.45%
jan 1, 2012
13.937
+0.037
0.26%
jan 1, 2013
14.22
+0.284
2.03%
jan 1, 2014
14.271
+0.051
0.36%
jan 1, 2015
14.046
-0.225
-1.58%
jan 1, 2016
13.894
-0.152
-1.08%
jan 1, 2017
13.462
-0.431
-3.11%
Ranking of countries by current statistics by years


Comments: