29
/
en
AIzaSyAYiBZKx7MnpbEhh9jyipgxe19OcubqV5w
April 1, 2024
177371
Lesotho
LSO
true
2
1
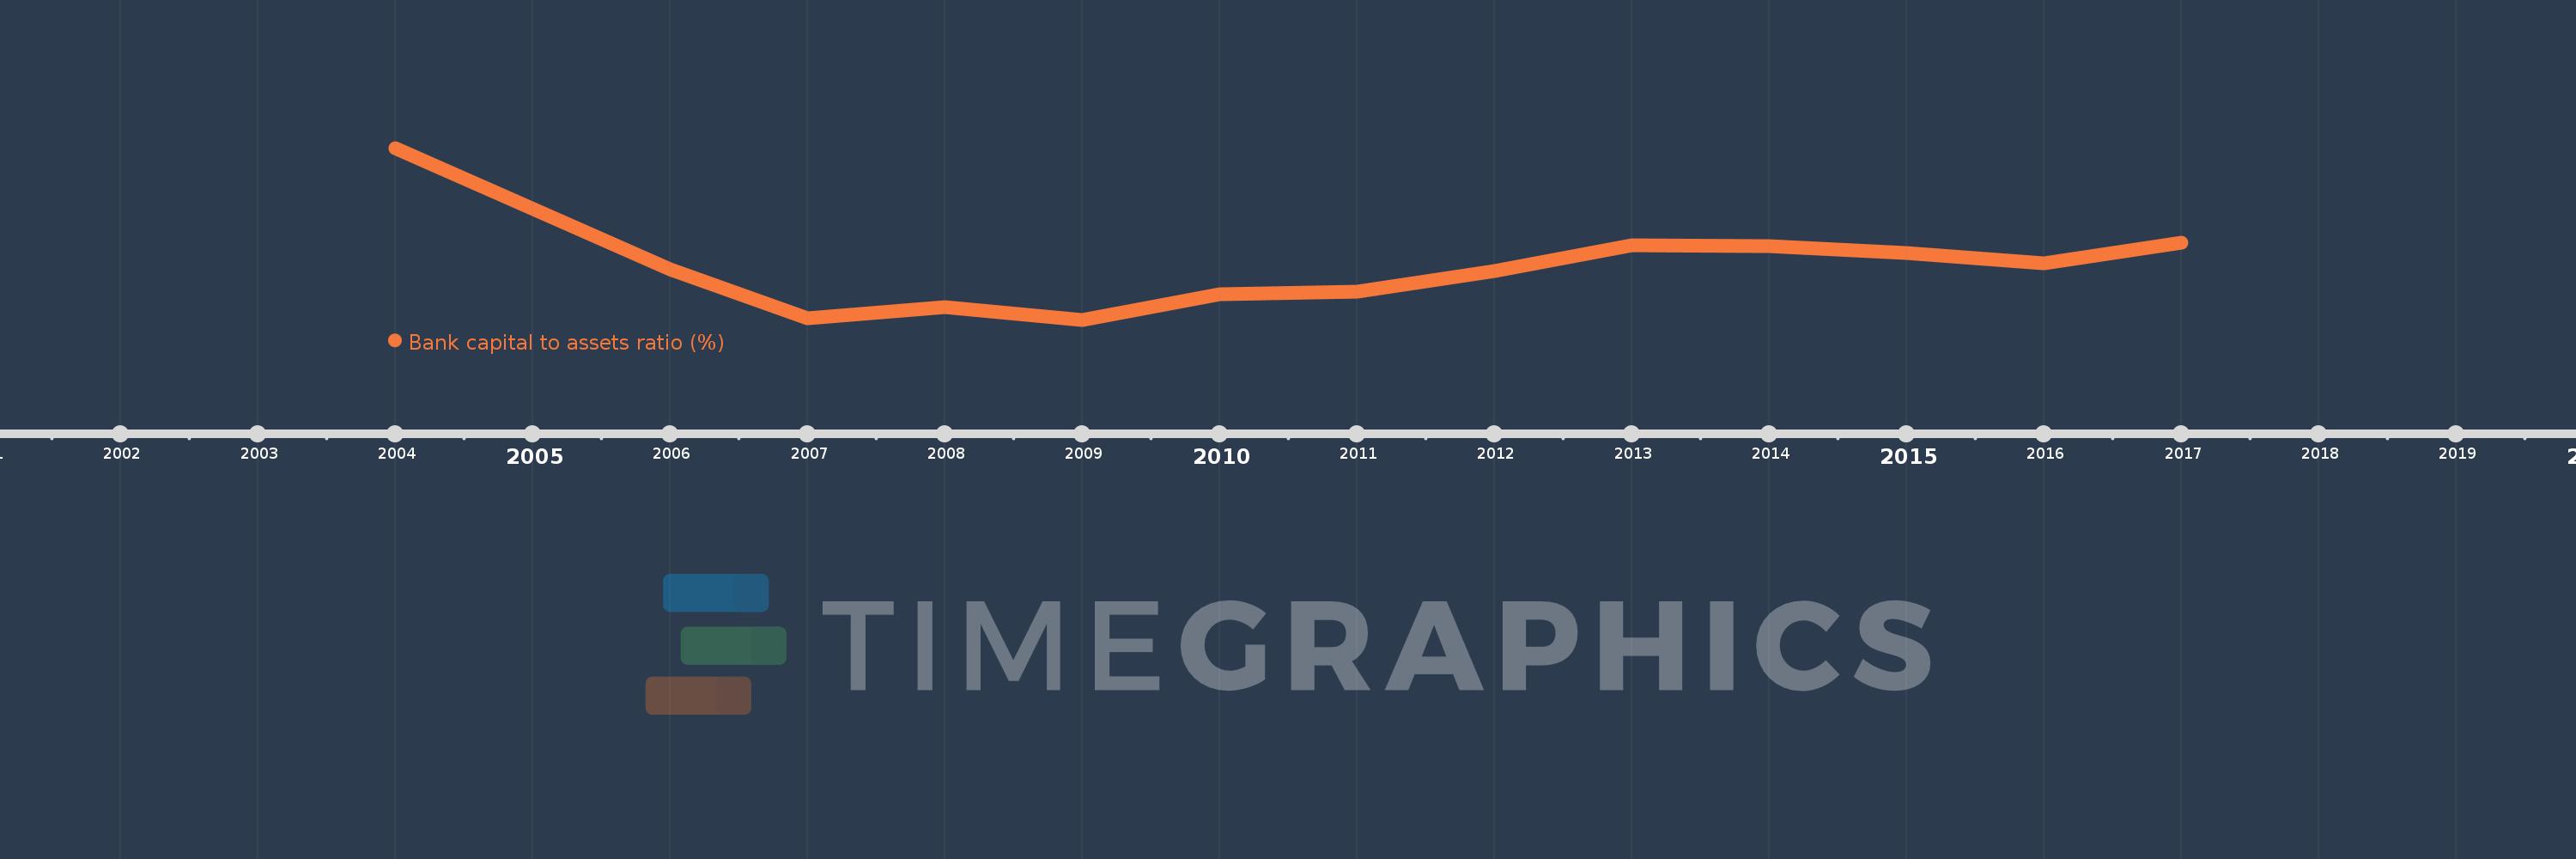
Bank capital to assets ratio (%)
2017,2016,2015,2014,2013,2012,2011,2010,2009,2008,2007,2006,2004
This statistics in other country:
Timeline:
This timeline shows a graph from 2004 to 2017 of Lesotho. No data until 2003. Number of actual observations by date: 13.
Source name:
World Development Indicators
Source organization:
International Monetary Fund, Global Financial Stability Report.
Categories, topics:
Financial Sector
Last updated:
apr 23, 2017
Indicators value changes by year
At the date of observation
Value
Absolute change
Change from previous value
jan 1, 2004
17.0
+17.0
0.0%
jan 1, 2006
10.2
-6.8
-40.0%
jan 1, 2007
7.5
-2.7
-26.47%
jan 1, 2009
7.4
-0.7
-8.64%
jan 1, 2010
8.814
+1.414
19.11%
jan 1, 2011
8.964
+0.15
1.7%
jan 1, 2012
10.113
+1.149
12.82%
jan 1, 2013
11.573
+1.46
14.44%
jan 1, 2014
11.535
-0.038
-0.33%
jan 1, 2015
11.107
-0.427
-3.7%
jan 1, 2016
10.532
-0.575
-5.18%
jan 1, 2017
11.719
+1.186
11.26%
Ranking of countries by current statistics by years


Comments: