29
/
en
AIzaSyAYiBZKx7MnpbEhh9jyipgxe19OcubqV5w
April 1, 2024
70800
Armenia
ARM
true
2
1
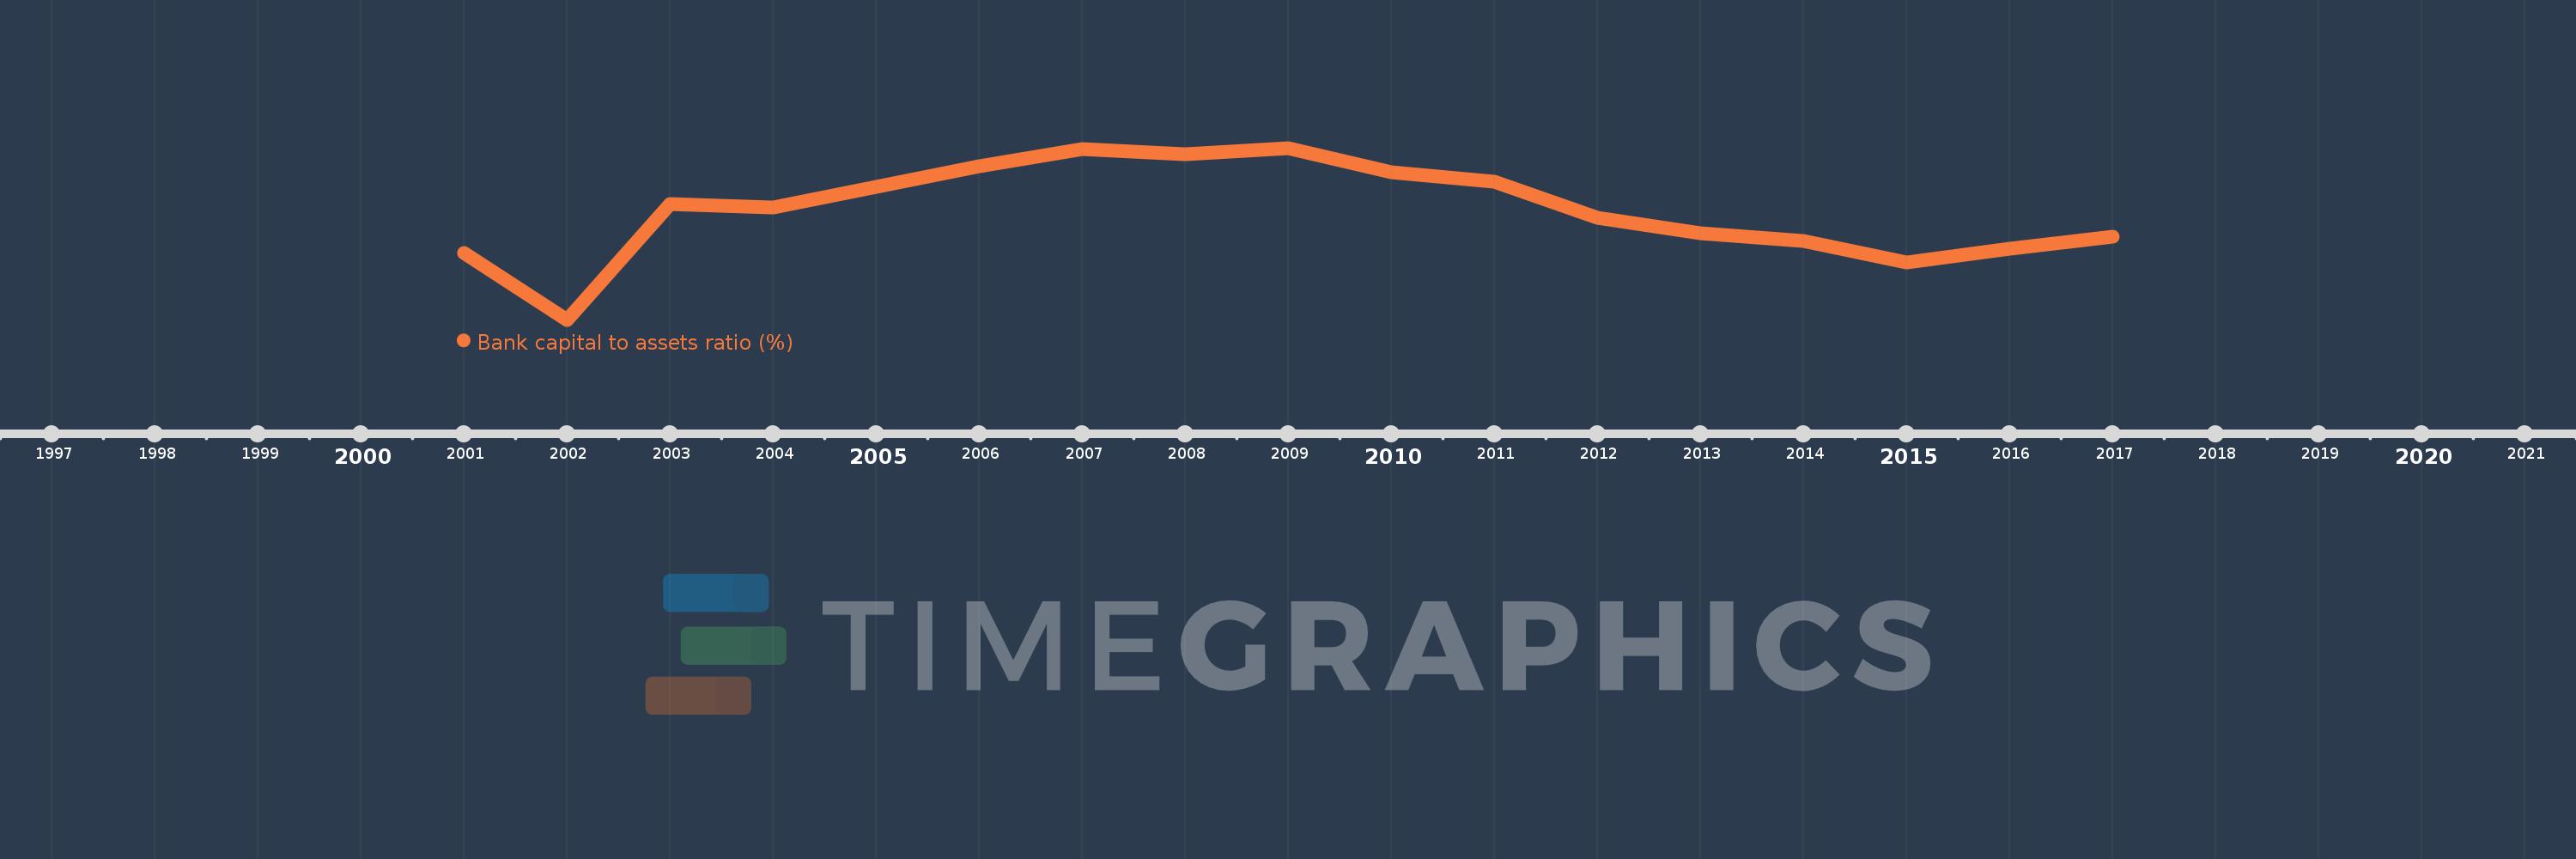
Bank capital to assets ratio (%)
2017,2016,2015,2014,2013,2012,2011,2010,2009,2008,2007,2006,2004,2003,2002,2001
This statistics in other country:
Timeline:
This timeline shows a graph from 2001 to 2017 of Armenia. No data until 2000. Number of actual observations by date: 16.
Source name:
World Development Indicators
Source organization:
International Monetary Fund, Global Financial Stability Report.
Categories, topics:
Financial Sector
Last updated:
apr 23, 2017
Indicators value changes by year
Maximum:
23.011
jan 1, 2009
At the date of observation
Value
Absolute change
Change from previous value
jan 1, 2001
14.3
+14.3
0.0%
jan 1, 2002
8.8
-5.5
-38.46%
jan 1, 2003
18.4
+9.6
109.09%
jan 1, 2004
18.1
-0.3
-1.63%
jan 1, 2006
21.5
+3.4
18.78%
jan 1, 2007
22.9
+1.4
6.51%
jan 1, 2008
22.5
-0.4
-1.75%
jan 1, 2009
23.011
+0.511
2.27%
jan 1, 2010
20.995
-2.017
-8.76%
jan 1, 2011
20.238
-0.757
-3.6%
jan 1, 2012
17.222
-3.016
-14.9%
jan 1, 2013
15.931
-1.291
-7.5%
jan 1, 2014
15.284
-0.646
-4.06%
jan 1, 2015
13.57
-1.715
-11.22%
jan 1, 2016
14.685
+1.115
8.22%
jan 1, 2017
15.675
+0.99
6.74%
Ranking of countries by current statistics by years


Comments: