29
/
en
AIzaSyAYiBZKx7MnpbEhh9jyipgxe19OcubqV5w
April 1, 2024
121793
Dominican Republic
DOM
true
2
1
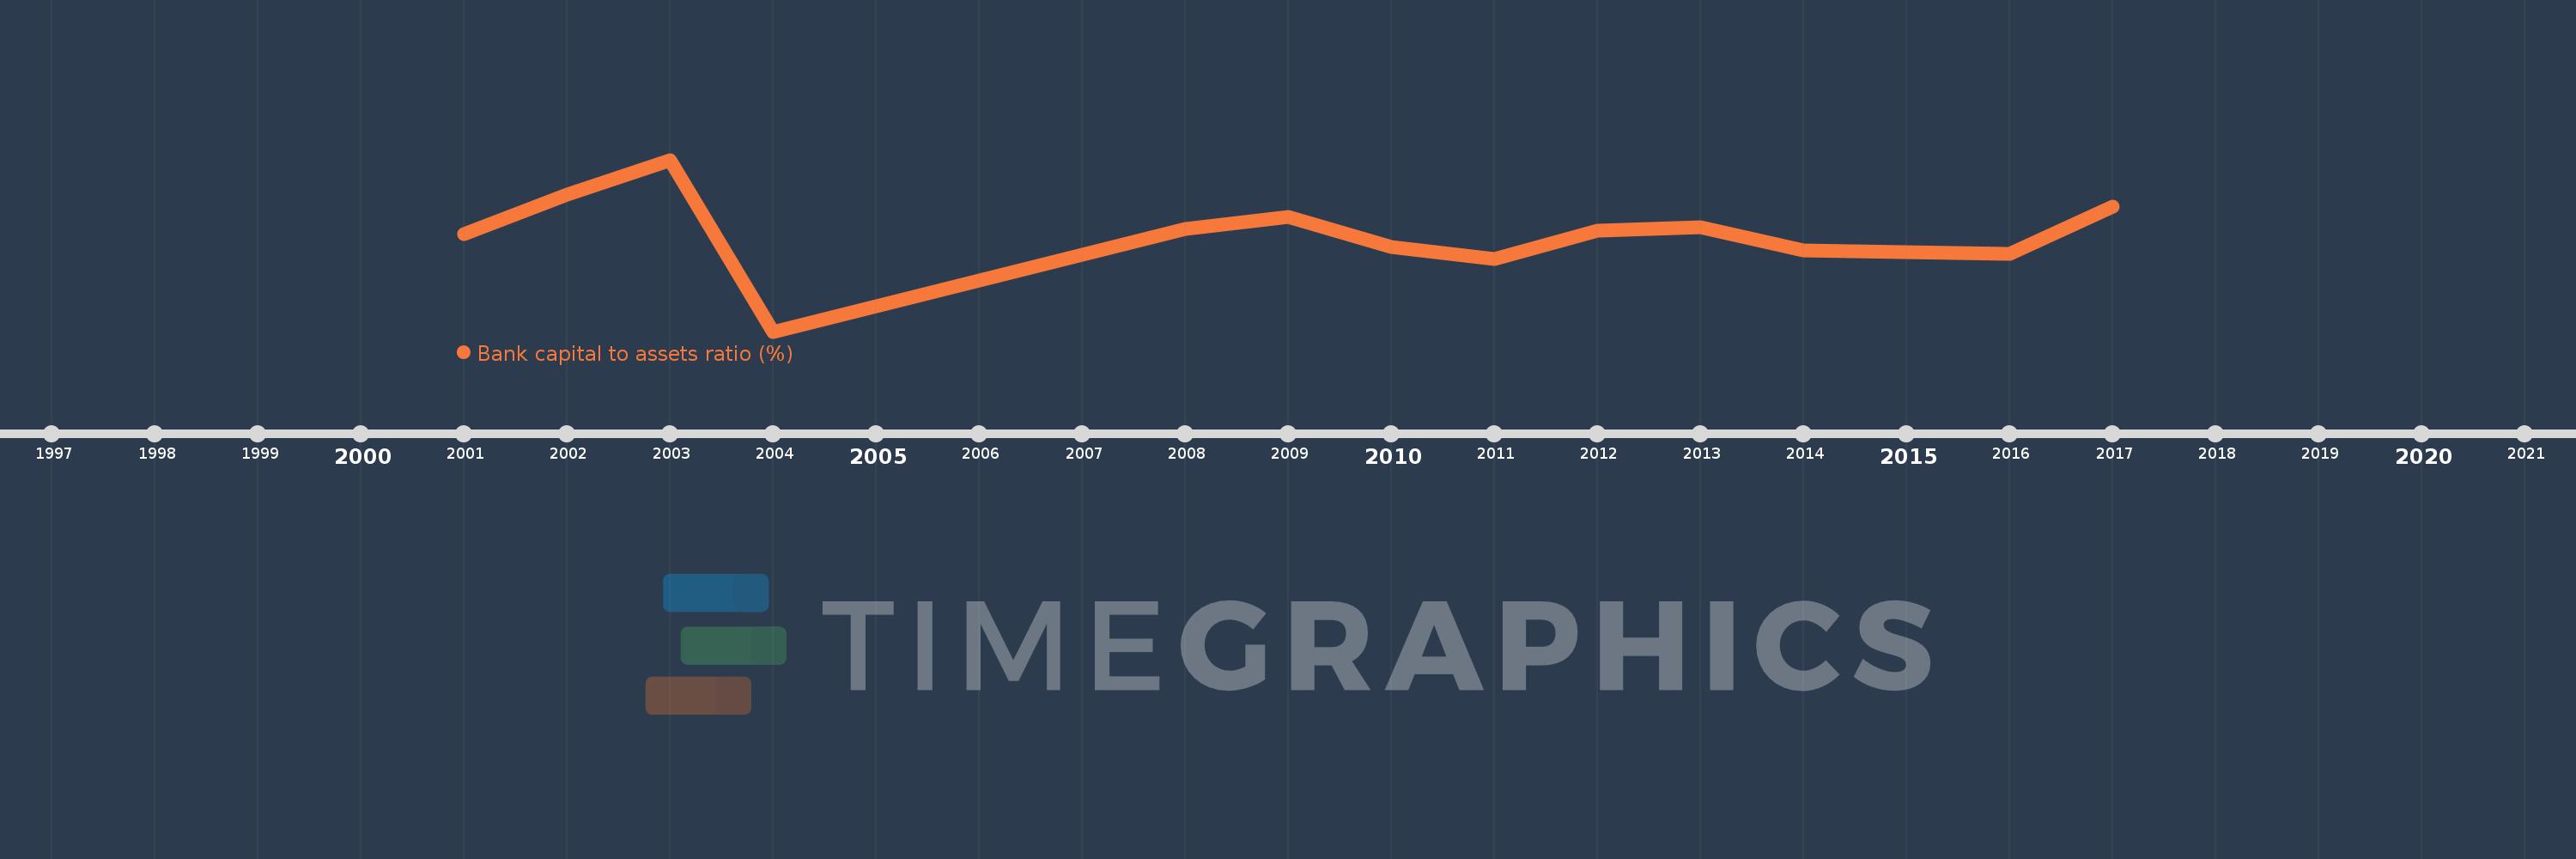
Bank capital to assets ratio (%)
2017,2016,2015,2014,2013,2012,2011,2010,2009,2008,2004,2003,2002,2001
This statistics in other country:
Timeline:
This timeline shows a graph from 2001 to 2017 of Dominican Republic. No data until 2000. Number of actual observations by date: 14.
Source name:
World Development Indicators
Source organization:
International Monetary Fund, Global Financial Stability Report.
Categories, topics:
Financial Sector
Last updated:
apr 23, 2017
Indicators value changes by year
At the date of observation
Value
Absolute change
Change from previous value
jan 1, 2002
10.1
+0.7
7.45%
jan 1, 2003
10.7
+0.6
5.94%
jan 1, 2004
7.7
-3.0
-28.04%
jan 1, 2008
9.5
+1.8
23.38%
jan 1, 2009
9.7
+0.2
2.11%
jan 1, 2010
9.183
-0.517
-5.33%
jan 1, 2011
8.97
-0.213
-2.32%
jan 1, 2012
9.461
+0.491
5.48%
jan 1, 2013
9.525
+0.064
0.68%
jan 1, 2014
9.116
-0.409
-4.29%
jan 1, 2015
9.083
-0.033
-0.37%
jan 1, 2016
9.058
-0.025
-0.27%
jan 1, 2017
9.885
+0.827
9.14%
Ranking of countries by current statistics by years


Comments: