29
/
en
AIzaSyAYiBZKx7MnpbEhh9jyipgxe19OcubqV5w
April 1, 2024
114557
Croatia
HRV
true
2
1
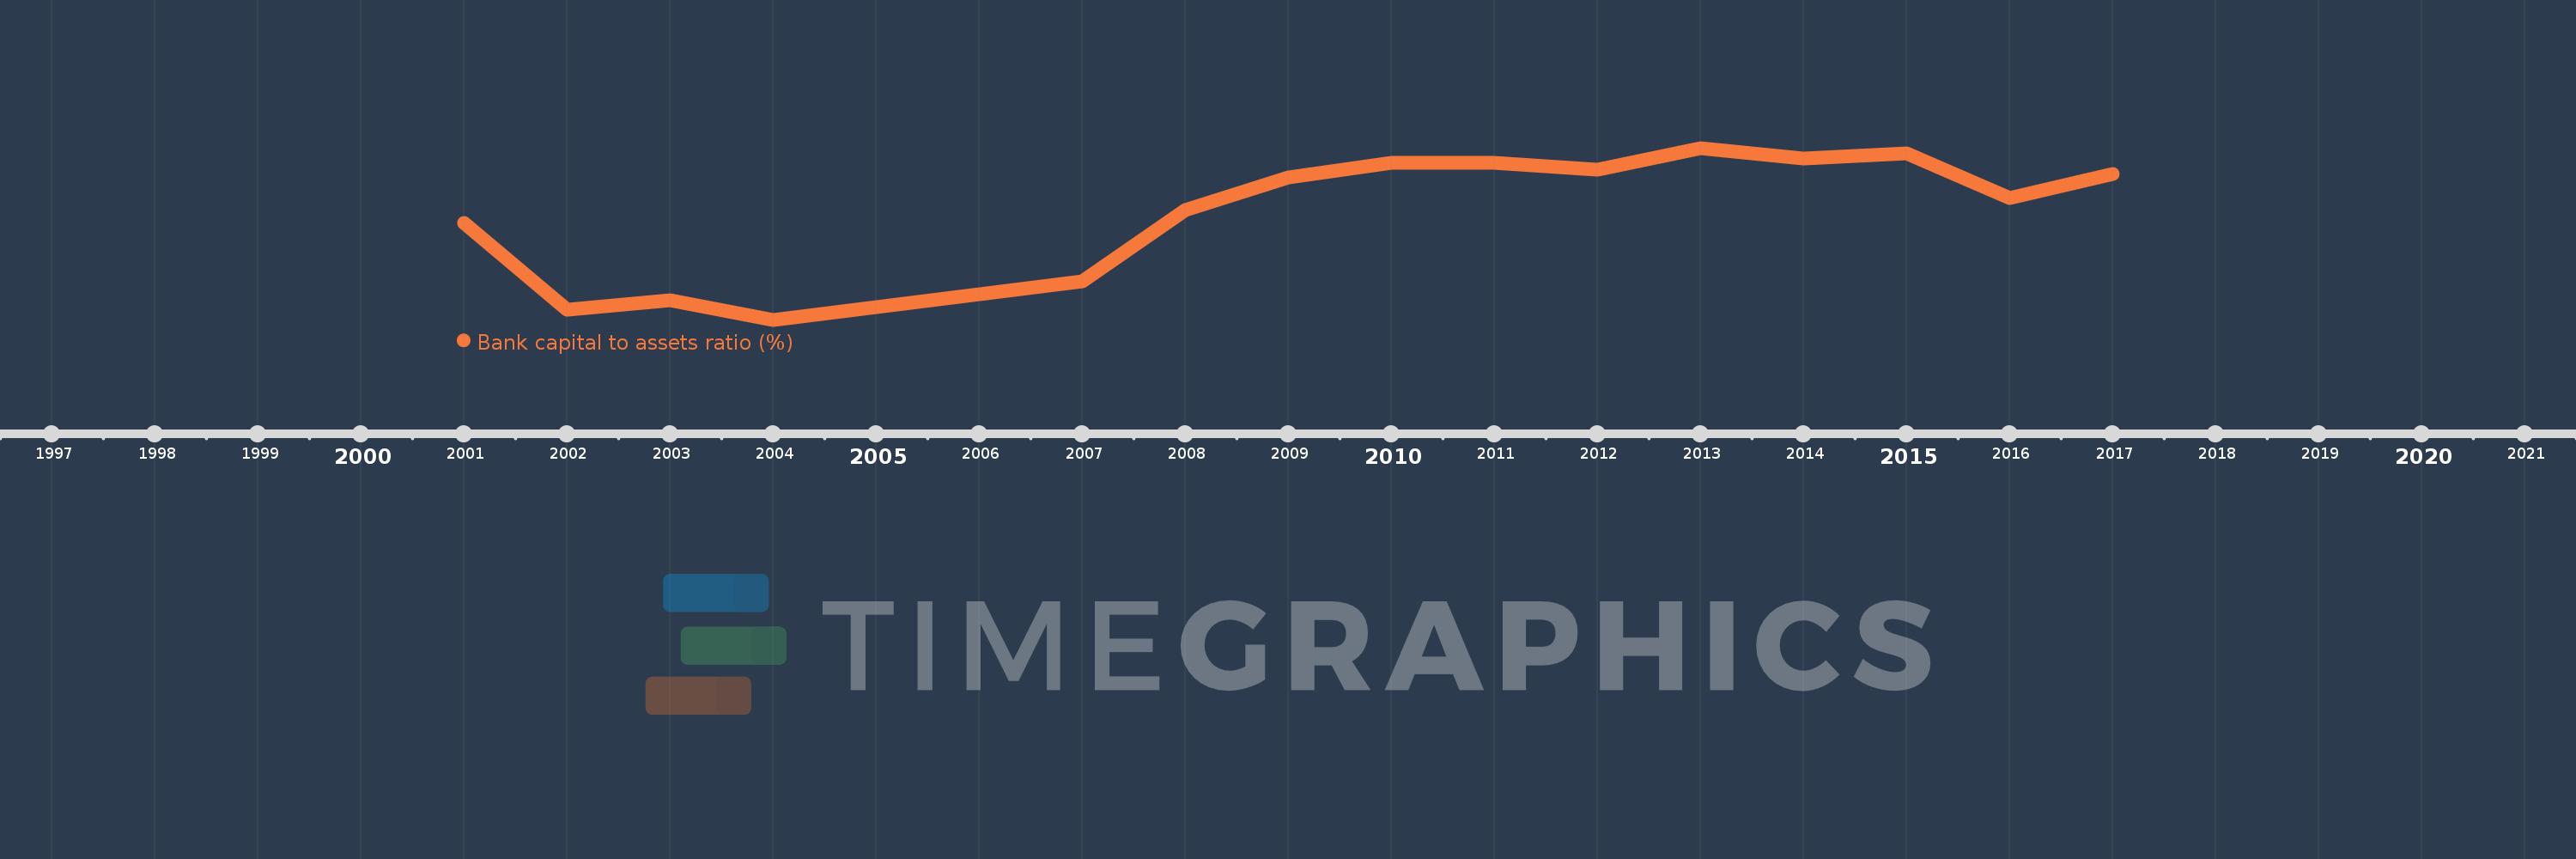
Bank capital to assets ratio (%)
2017,2016,2015,2014,2013,2012,2011,2010,2009,2008,2007,2004,2003,2002,2001
This statistics in other country:
Timeline:
This timeline shows a graph from 2001 to 2017 of Croatia. No data until 2000. Number of actual observations by date: 15.
Source name:
World Development Indicators
Source organization:
International Monetary Fund, Global Financial Stability Report.
Categories, topics:
Financial Sector
Last updated:
apr 23, 2017
Indicators value changes by year
Maximum:
14.224
jan 1, 2013
At the date of observation
Value
Absolute change
Change from previous value
jan 1, 2001
11.9
+11.9
0.0%
jan 1, 2002
9.2
-2.7
-22.69%
jan 1, 2003
9.5
+0.3
3.26%
jan 1, 2004
8.9
-0.6
-6.32%
jan 1, 2007
10.1
+1.2
13.48%
jan 1, 2008
12.3
+2.2
21.78%
jan 1, 2009
13.3
+1.0
8.13%
jan 1, 2010
13.761
+0.461
3.46%
jan 1, 2011
13.769
+0.008
0.06%
jan 1, 2012
13.561
-0.208
-1.51%
jan 1, 2013
14.224
+0.663
4.89%
jan 1, 2014
13.89
-0.334
-2.35%
jan 1, 2015
14.044
+0.153
1.1%
jan 1, 2016
12.683
-1.361
-9.69%
jan 1, 2017
13.428
+0.745
5.88%
Ranking of countries by current statistics by years


Comments: