29
/
en
AIzaSyAYiBZKx7MnpbEhh9jyipgxe19OcubqV5w
April 1, 2024
223219
Philippines
PHL
true
2
1
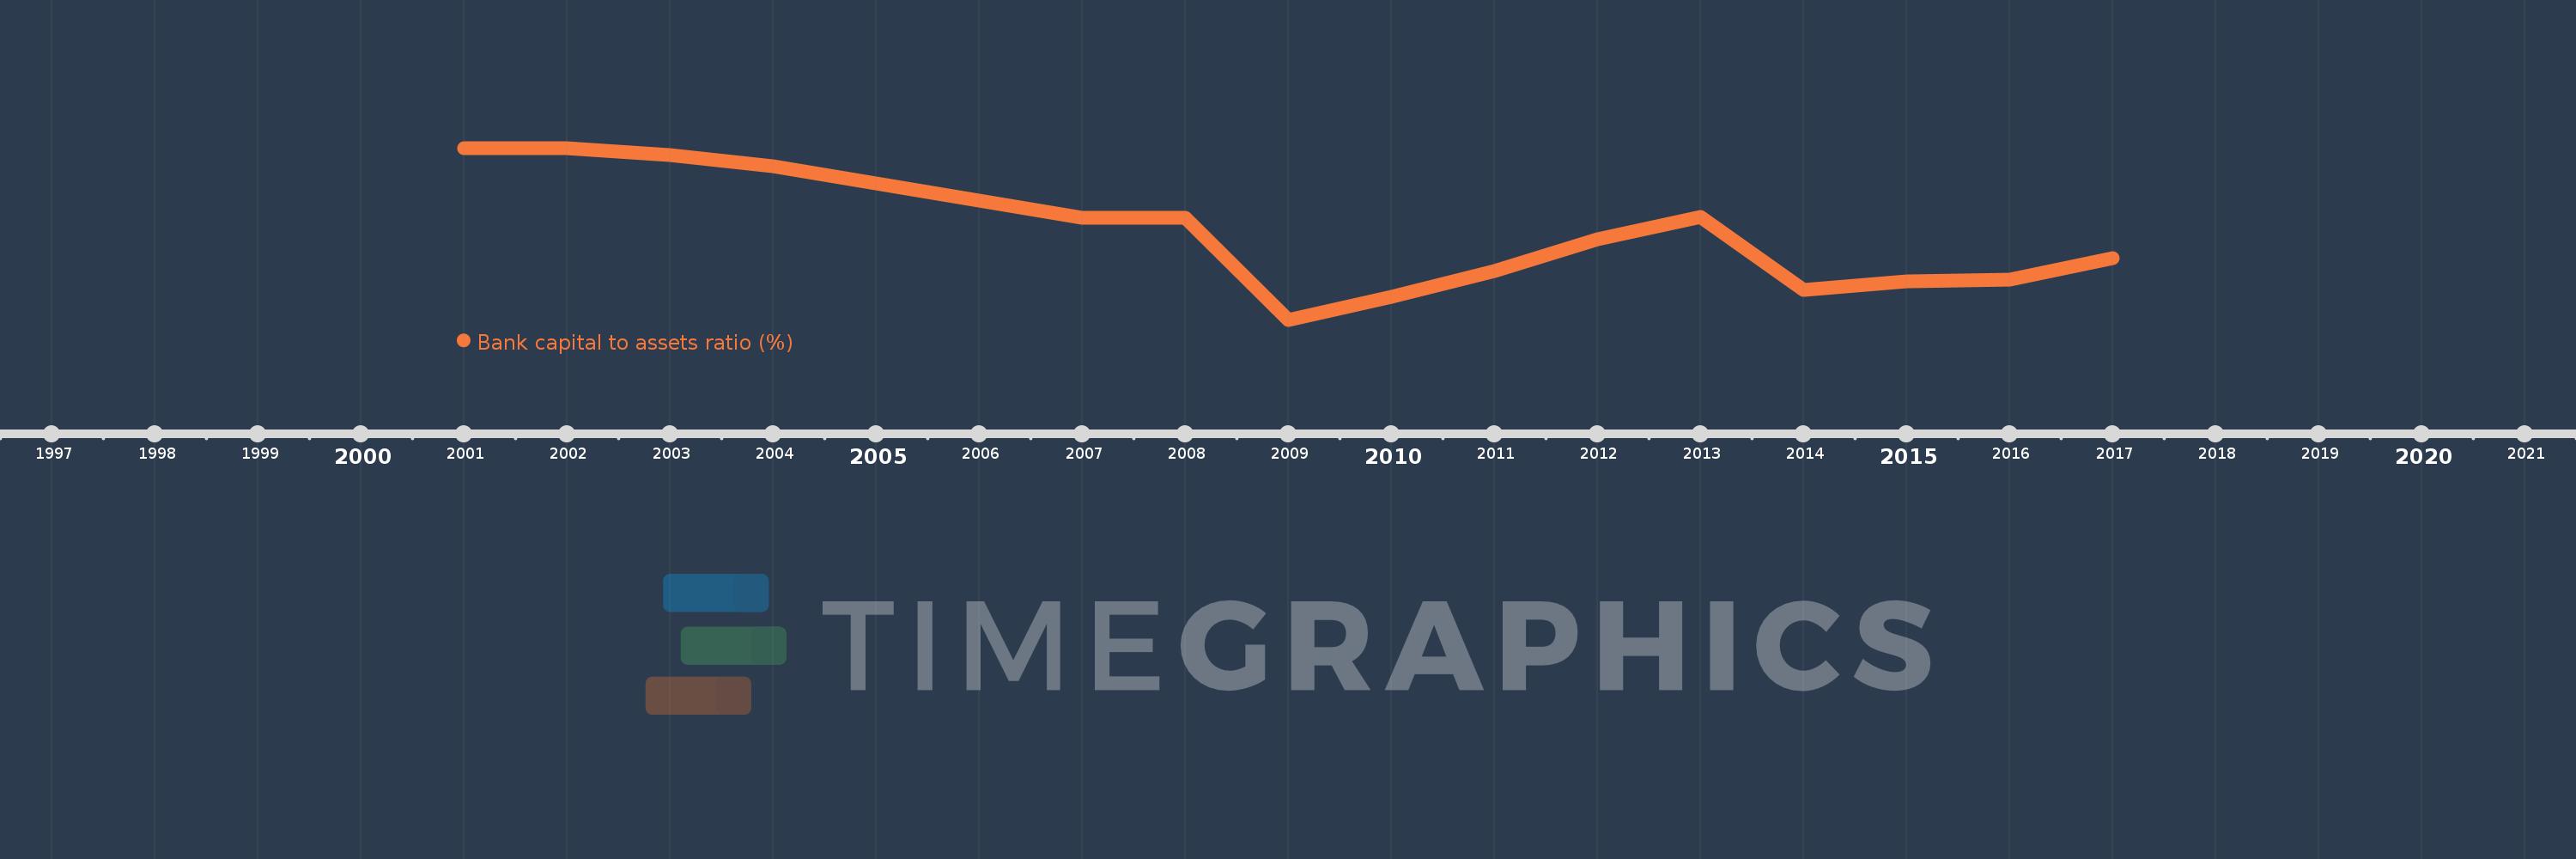
Bank capital to assets ratio (%)
2017,2016,2015,2014,2013,2012,2011,2010,2009,2008,2007,2004,2003,2002,2001
This statistics in other country:
Timeline:
This timeline shows a graph from 2001 to 2017 of Philippines. No data until 2000. Number of actual observations by date: 15.
Source name:
World Development Indicators
Source organization:
International Monetary Fund, Global Financial Stability Report.
Categories, topics:
Financial Sector
Last updated:
apr 23, 2017
Indicators value changes by year
At the date of observation
Value
Absolute change
Change from previous value
jan 1, 2001
13.6
+13.6
0.0%
jan 1, 2003
13.4
-0.2
-1.47%
jan 1, 2004
13.1
-0.3
-2.24%
jan 1, 2007
11.7
-1.4
-10.69%
jan 1, 2009
8.9
-2.8
-23.93%
jan 1, 2010
9.532
+0.632
7.1%
jan 1, 2011
10.234
+0.702
7.36%
jan 1, 2012
11.091
+0.857
8.37%
jan 1, 2013
11.703
+0.612
5.52%
jan 1, 2014
9.704
-1.999
-17.08%
jan 1, 2015
9.948
+0.244
2.51%
jan 1, 2016
9.987
+0.039
0.39%
jan 1, 2017
10.591
+0.603
6.04%
Ranking of countries by current statistics by years


Comments: