29
/
en
AIzaSyAYiBZKx7MnpbEhh9jyipgxe19OcubqV5w
April 1, 2024
31340
Europe & Central Asia (excluding high income)
ECA
false
2
1
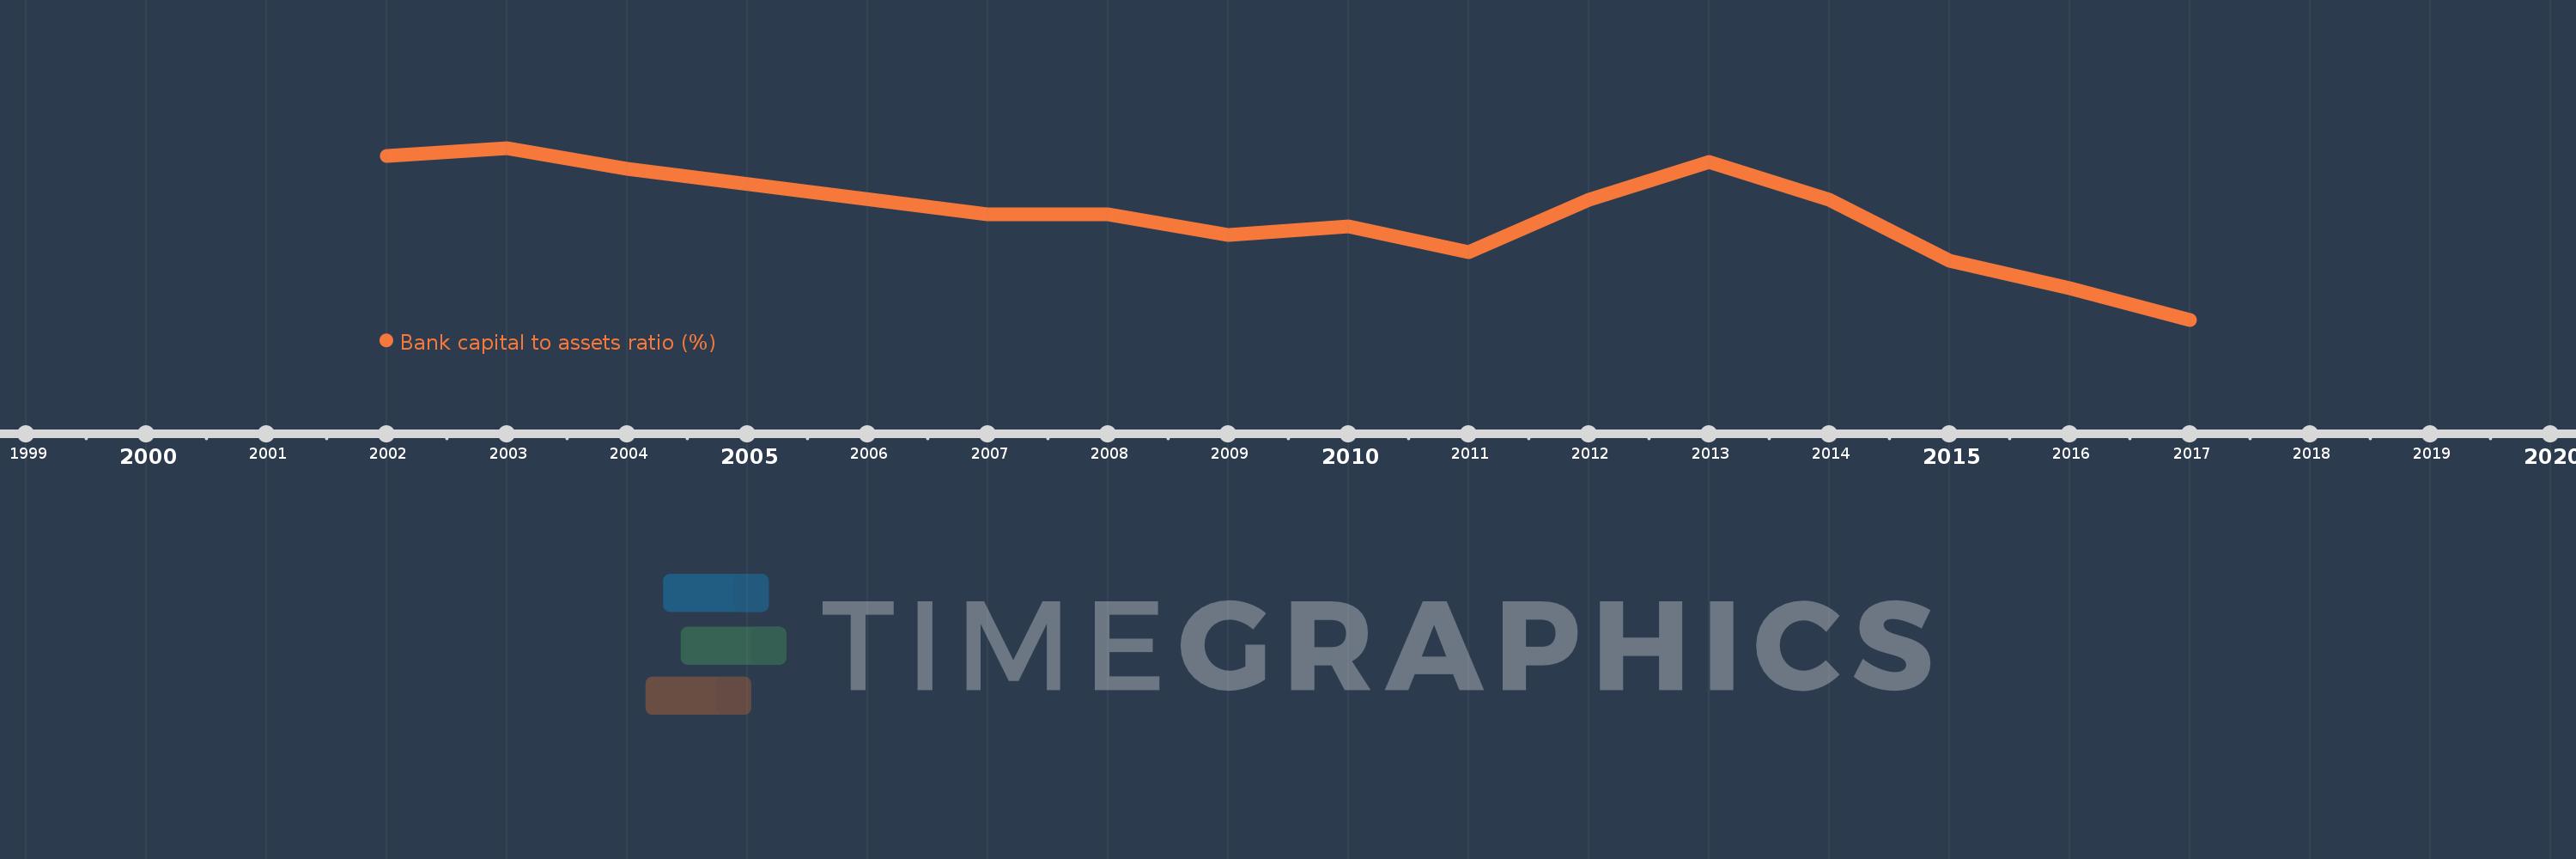
Bank capital to assets ratio (%)
2017,2016,2015,2014,2013,2012,2011,2010,2009,2008,2007,2004,2003,2002
This statistics in other country:
Timeline:
This timeline shows a graph from 2002 to 2017 of Europe & Central Asia (excluding high income). No data until 2001. Number of actual observations by date: 14.
Source name:
World Development Indicators
Source organization:
International Monetary Fund, Global Financial Stability Report.
Categories, topics:
Financial Sector
Last updated:
apr 23, 2017
Indicators value changes by year
Minimum:
11.303
jan 1, 2017
At the date of observation
Value
Absolute change
Change from previous value
jan 1, 2002
14.4
+14.4
0.0%
jan 1, 2003
14.55
+0.15
1.04%
jan 1, 2004
14.15
-0.4
-2.75%
jan 1, 2007
13.3
-0.85
-6.01%
jan 1, 2009
12.9
-0.4
-3.01%
jan 1, 2010
13.069
+0.169
1.31%
jan 1, 2011
12.588
-0.481
-3.68%
jan 1, 2012
13.572
+0.985
7.82%
jan 1, 2013
14.284
+0.711
5.24%
jan 1, 2014
13.579
-0.705
-4.93%
jan 1, 2015
12.411
-1.168
-8.6%
jan 1, 2016
11.891
-0.52
-4.19%
jan 1, 2017
11.303
-0.588
-4.94%
Ranking of countries by current statistics by years


Comments: