29
/
en
AIzaSyAYiBZKx7MnpbEhh9jyipgxe19OcubqV5w
April 1, 2024
86285
Bhutan
BTN
true
2
1
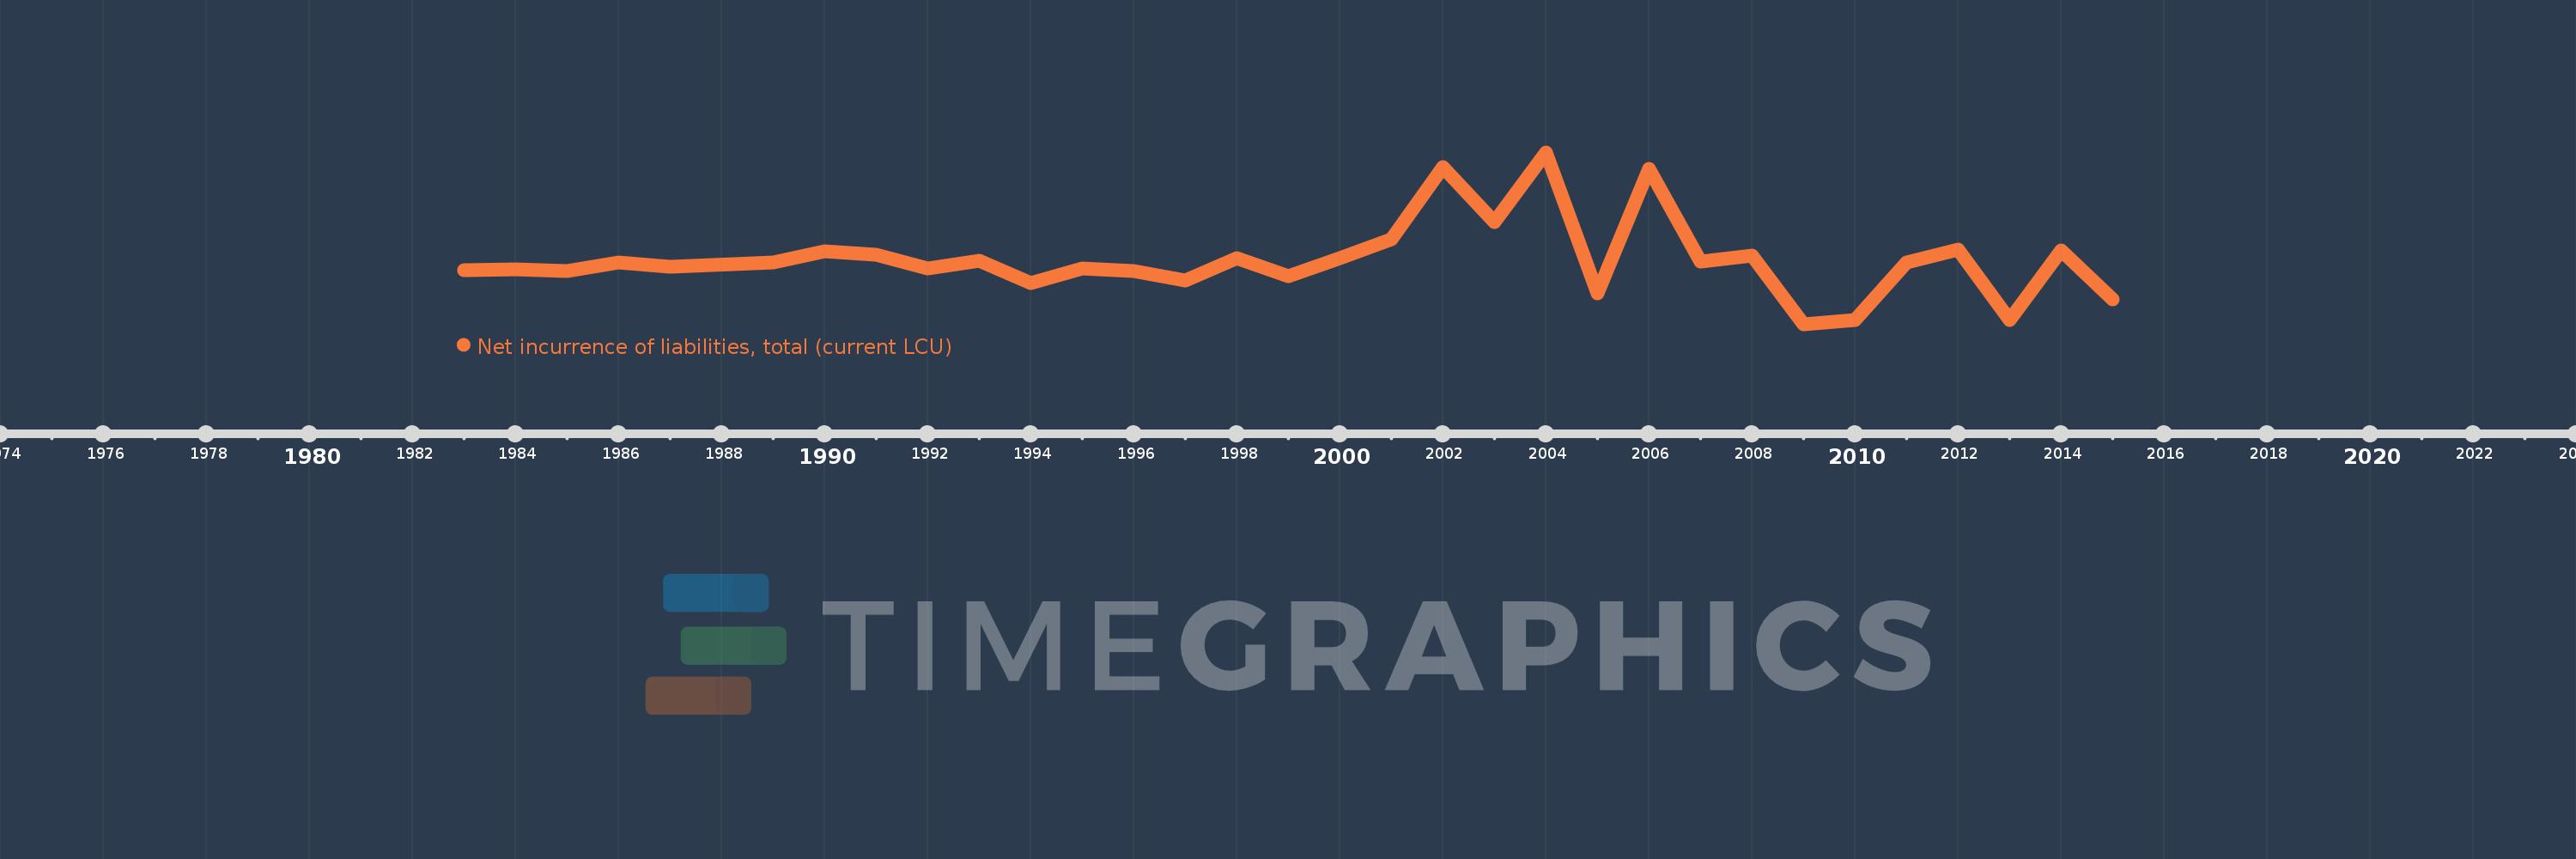
Net incurrence of liabilities, total (current LCU)
2015,2014,2013,2012,2011,2010,2009,2008,2007,2006,2005,2004,2003,2002,2001,2000,1999,1998,1997,1996,1995,1994,1993,1992,1991,1990,1989,1987,1986,1985,1984,1983
This statistics in other country:
Timeline:
This timeline shows a graph from 1983 to 2015 of Bhutan. No data until 1982. Number of actual observations by date: 32.
Source name:
World Development Indicators
Source organization:
International Monetary Fund, Government Finance Statistics Yearbook and data files.
Categories, topics:
Public Sector
Last updated:
apr 23, 2017
Indicators value changes by year
Minimum:
-1.319 bln
jan 1, 2009
Maximum:
2.896 bln
jan 1, 2004
At the date of observation
Value
Absolute change
Change from previous value
jan 1, 1983
16.6 mln
+16.6 mln
0.0%
jan 1, 1984
26.9 mln
+10.3 mln
62.05%
jan 1, 1985
-20.5 mln
-47.4 mln
-176.21%
jan 1, 1986
205.3 mln
+225.8 mln
-1.1K%
jan 1, 1987
95.0 mln
-110.3 mln
-53.73%
jan 1, 1989
199.2 mln
+104.2 mln
109.68%
jan 1, 1990
470.6 mln
+271.4 mln
136.24%
jan 1, 1991
390.0 mln
-80.6 mln
-17.13%
jan 1, 1992
47.0 mln
-343.0 mln
-87.95%
jan 1, 1993
245.9 mln
+198.9 mln
423.19%
jan 1, 1994
-311.4 mln
-557.3 mln
-226.64%
jan 1, 1995
46.6 mln
+358.0 mln
-114.96%
jan 1, 1996
-4.2 mln
-50.8 mln
-109.01%
jan 1, 1997
-239.8 mln
-235.6 mln
5.61K%
jan 1, 1998
299.898 mln
+539.698 mln
-225.06%
jan 1, 1999
-147.8 mln
-447.698 mln
-149.28%
jan 1, 2000
308.9 mln
+456.7 mln
-309.0%
jan 1, 2001
768.9 mln
+460.0 mln
148.92%
jan 1, 2002
2.541 bln
+1.772 bln
230.43%
jan 1, 2003
1.181 bln
-1.359 bln
-53.5%
jan 1, 2004
2.896 bln
+1.714 bln
145.11%
jan 1, 2005
-556.304 mln
-3.452 bln
-119.21%
jan 1, 2006
2.492 bln
+3.049 bln
-548.04%
jan 1, 2007
215.476 mln
-2.277 bln
-91.35%
jan 1, 2008
354.845 mln
+139.369 mln
64.68%
jan 1, 2009
-1.319 bln
-1.674 bln
-471.77%
jan 1, 2010
-1.219 bln
+100.496 mln
-7.62%
jan 1, 2011
192.542 mln
+1.411 bln
-115.8%
jan 1, 2012
509.203 mln
+316.661 mln
164.46%
jan 1, 2013
-1.217 bln
-1.726 bln
-338.96%
jan 1, 2014
484.096 mln
+1.701 bln
-139.79%
jan 1, 2015
-704.151 mln
-1.188 bln
-245.46%
Ranking of countries by current statistics by years


Comments: