29
/
en
AIzaSyAYiBZKx7MnpbEhh9jyipgxe19OcubqV5w
April 1, 2024
107648
Colombia
COL
true
2
1
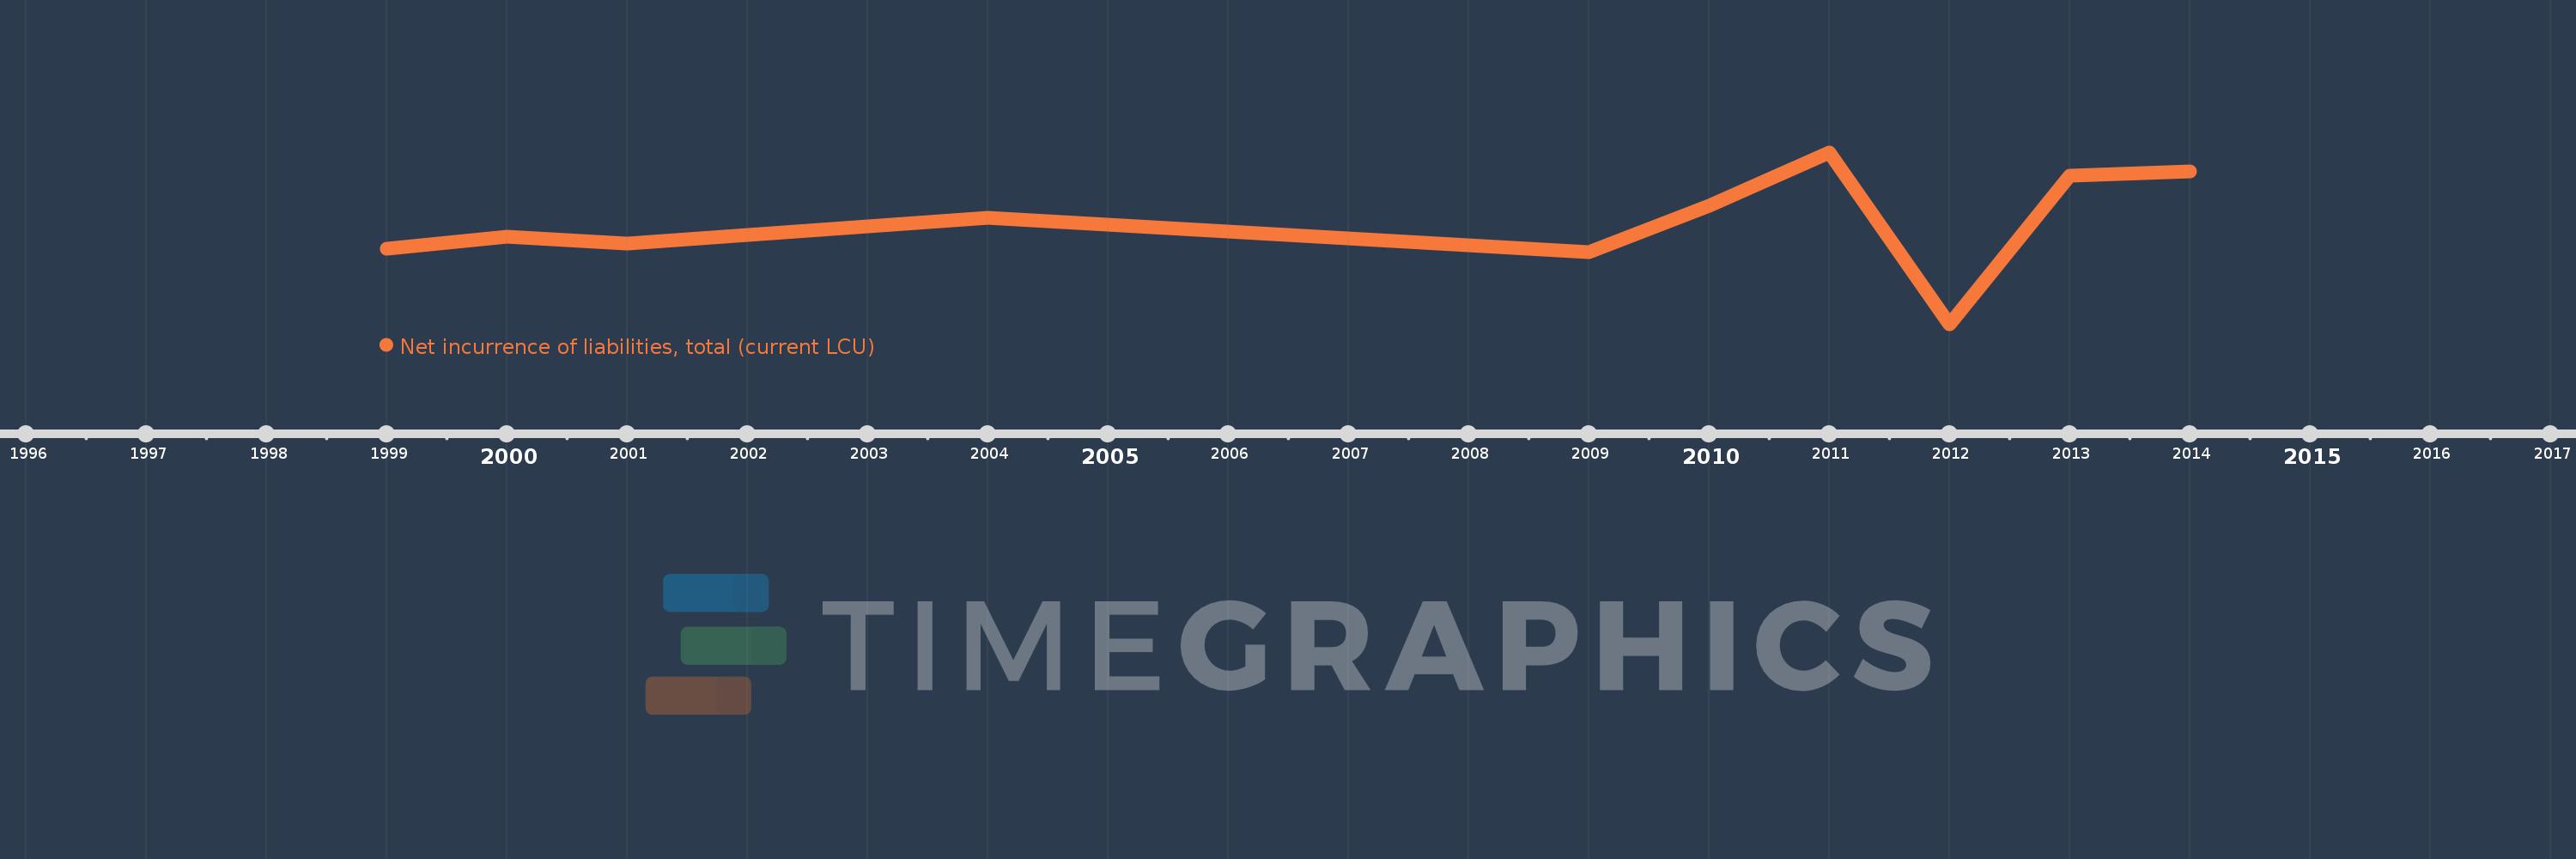
Net incurrence of liabilities, total (current LCU)
2014,2013,2012,2011,2010,2009,2004,2001,2000,1999
This statistics in other country:
Timeline:
This timeline shows a graph from 1999 to 2014 of Colombia. No data until 1998. Number of actual observations by date: 10.
Source name:
World Development Indicators
Source organization:
International Monetary Fund, Government Finance Statistics Yearbook and data files.
Categories, topics:
Public Sector
Last updated:
apr 23, 2017
Indicators value changes by year
Minimum:
-16.758 trl
jan 1, 2012
Maximum:
38.548 trl
jan 1, 2011
At the date of observation
Value
Absolute change
Change from previous value
jan 1, 1999
7.592 trl
+7.592 trl
0.0%
jan 1, 2000
11.395 trl
+3.803 trl
50.1%
jan 1, 2001
9.334 trl
-2.061 trl
-18.09%
jan 1, 2004
17.427 trl
+8.093 trl
86.71%
jan 1, 2009
6.507 trl
-10.92 trl
-62.66%
jan 1, 2010
21.488 trl
+14.98 trl
230.21%
jan 1, 2011
38.548 trl
+17.06 trl
79.39%
jan 1, 2012
-16.758 trl
-55.306 trl
-143.47%
jan 1, 2013
31.169 trl
+47.927 trl
-285.99%
jan 1, 2014
32.334 trl
+1.165 trl
3.74%
Ranking of countries by current statistics by years


Comments: