29
/
en
AIzaSyAYiBZKx7MnpbEhh9jyipgxe19OcubqV5w
April 1, 2024
186889
Malawi
MWI
true
2
1
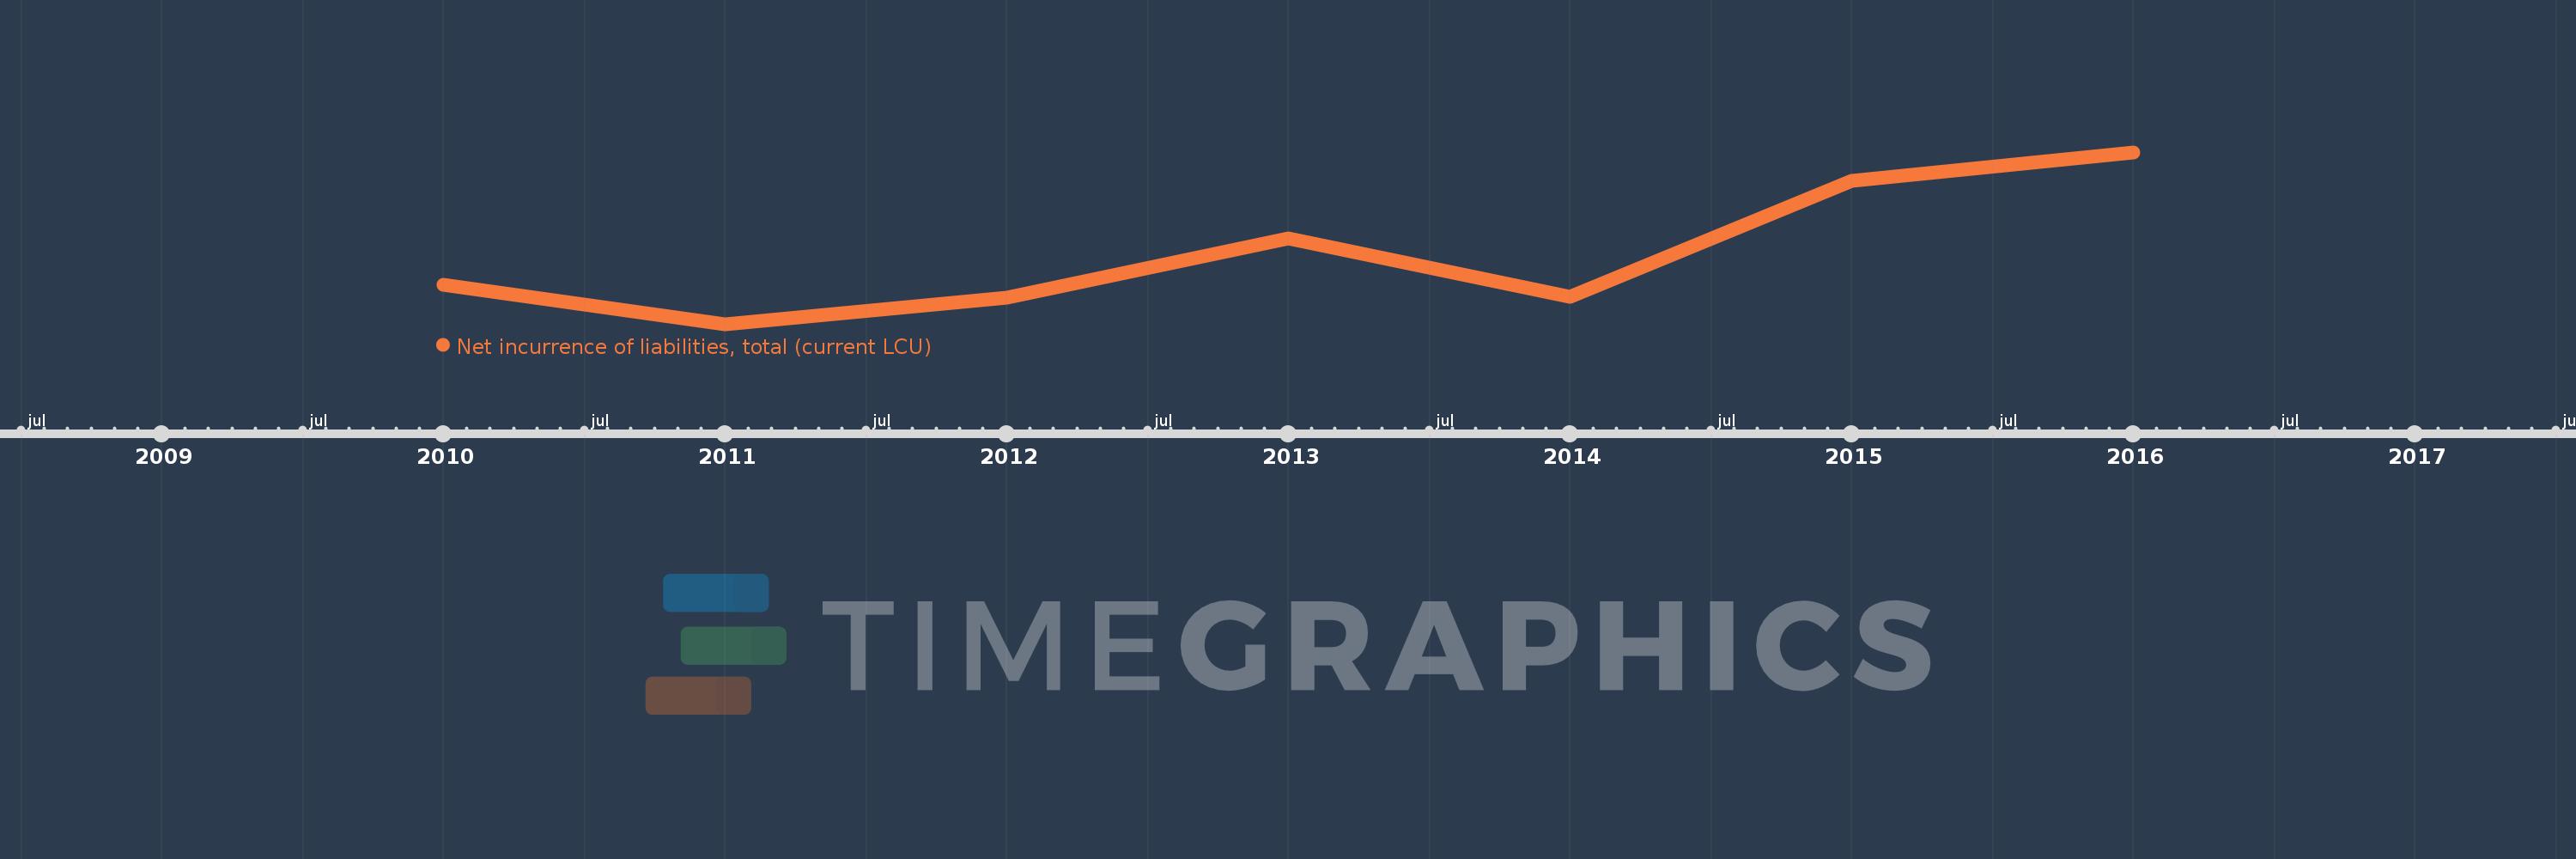
Net incurrence of liabilities, total (current LCU)
2016,2015,2014,2013,2012,2011,2010
This statistics in other country:
Timeline:
This timeline shows a graph from 2010 to 2016 of Malawi. No data until 2009. Number of actual observations by date: 7.
Source name:
World Development Indicators
Source organization:
International Monetary Fund, Government Finance Statistics Yearbook and data files.
Categories, topics:
Public Sector
Last updated:
apr 23, 2017
Indicators value changes by year
Minimum:
2.772 bln
jan 1, 2011
Maximum:
164.293 bln
jan 1, 2016
At the date of observation
Value
Absolute change
Change from previous value
jan 1, 2010
39.838 bln
+39.838 bln
0.0%
jan 1, 2011
2.772 bln
-37.066 bln
-93.04%
jan 1, 2012
27.374 bln
+24.602 bln
887.36%
jan 1, 2013
83.611 bln
+56.237 bln
205.44%
jan 1, 2014
28.775 bln
-54.836 bln
-65.58%
jan 1, 2015
137.752 bln
+108.977 bln
378.72%
jan 1, 2016
164.293 bln
+26.54 bln
19.27%
Ranking of countries by current statistics by years


Comments: