29
/
en
AIzaSyAYiBZKx7MnpbEhh9jyipgxe19OcubqV5w
April 1, 2024
264976
Togo
TGO
true
2
1
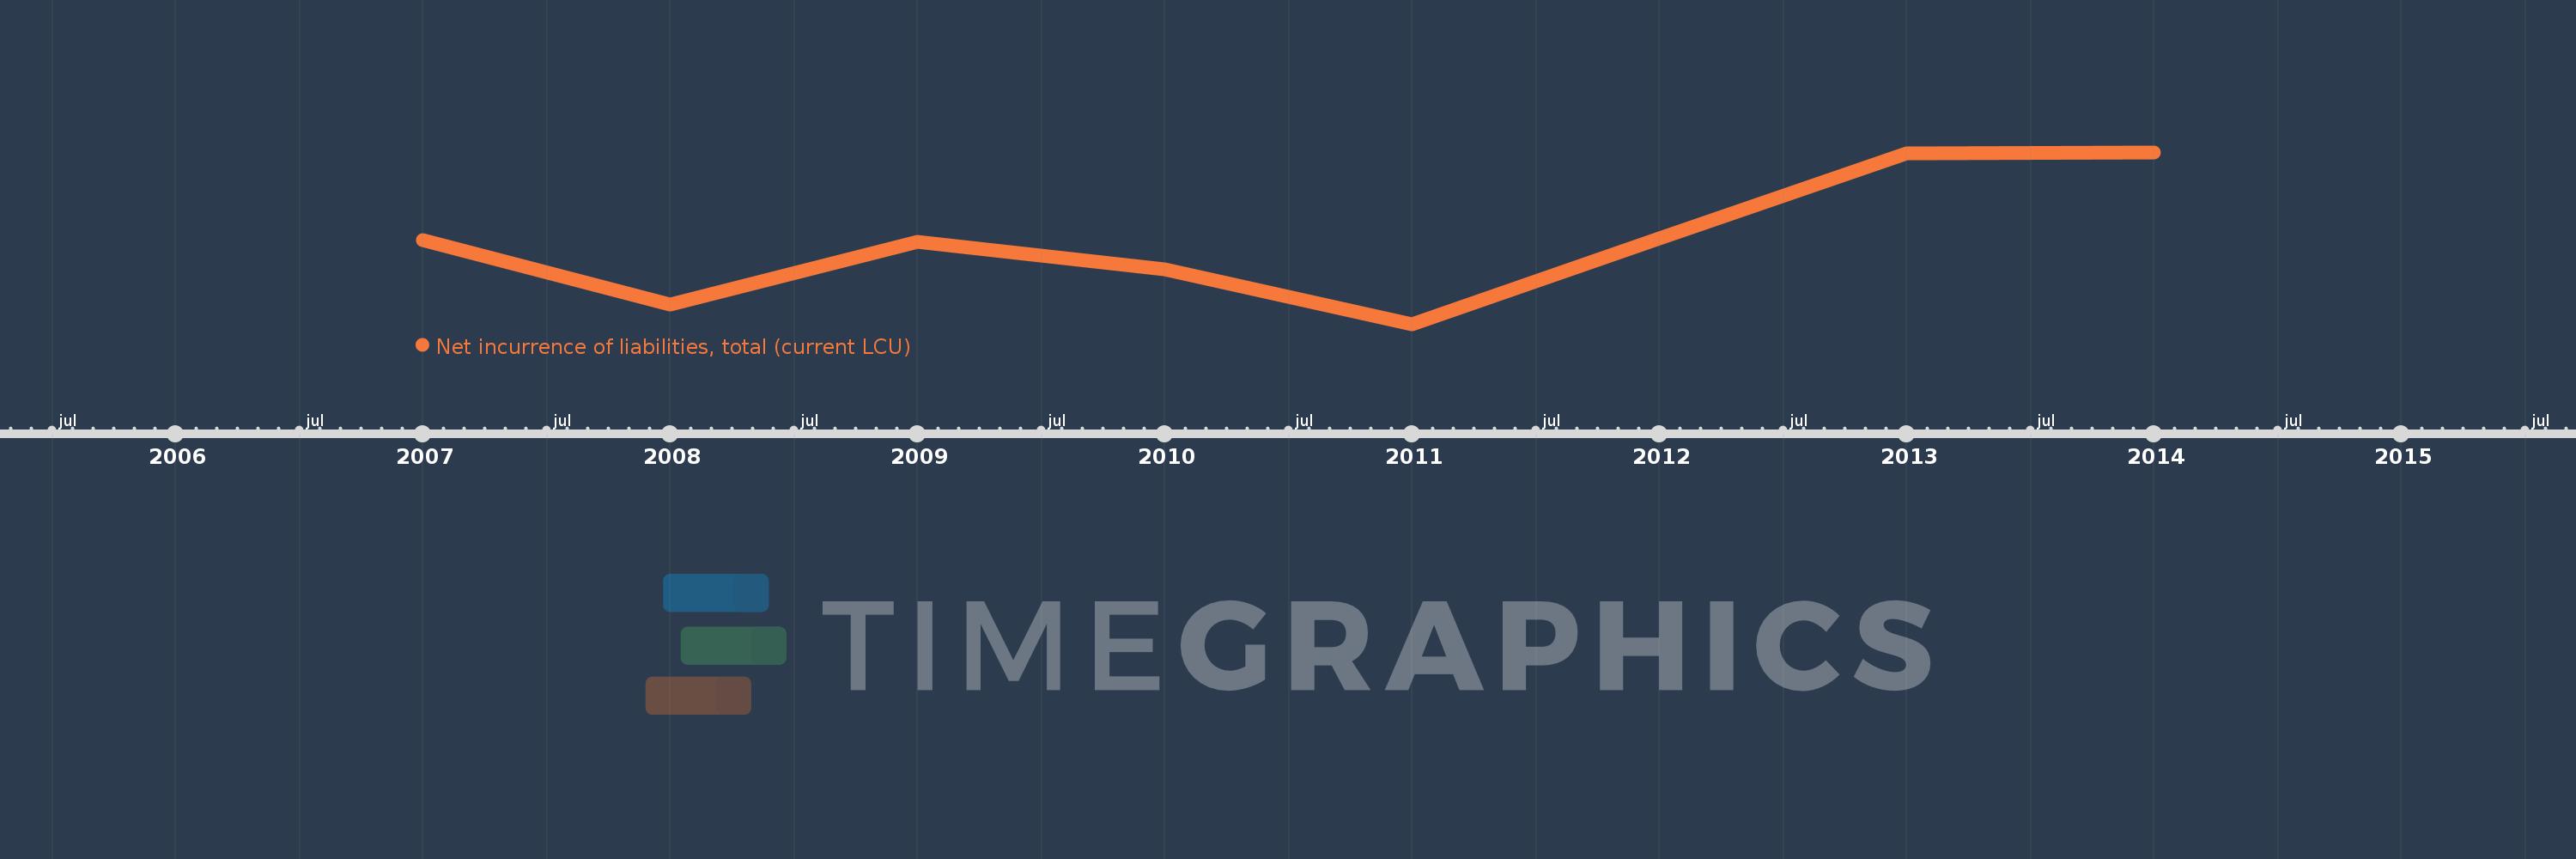
Net incurrence of liabilities, total (current LCU)
2014,2013,2012,2011,2010,2009,2008,2007
This statistics in other country:
Timeline:
This timeline shows a graph from 2007 to 2014 of Togo. No data until 2006. Number of actual observations by date: 8.
Source name:
World Development Indicators
Source organization:
International Monetary Fund, Government Finance Statistics Yearbook and data files.
Categories, topics:
Public Sector
Last updated:
apr 23, 2017
Indicators value changes by year
Minimum:
-12.154 bln
jan 1, 2011
Maximum:
121.798 bln
jan 1, 2014
At the date of observation
Value
Absolute change
Change from previous value
jan 1, 2007
53.665 bln
+53.665 bln
0.0%
jan 1, 2008
3.055 bln
-50.61 bln
-94.31%
jan 1, 2009
52.096 bln
+49.041 bln
1.61K%
jan 1, 2010
30.405 bln
-21.691 bln
-41.64%
jan 1, 2011
-12.154 bln
-42.56 bln
-139.97%
jan 1, 2012
54.49 bln
+66.644 bln
-548.32%
jan 1, 2013
120.904 bln
+66.414 bln
121.88%
jan 1, 2014
121.798 bln
+894.157 mln
0.74%
Ranking of countries by current statistics by years


Comments: