29
/
en
AIzaSyAYiBZKx7MnpbEhh9jyipgxe19OcubqV5w
April 1, 2024
159719
Ireland
IRL
true
2
1
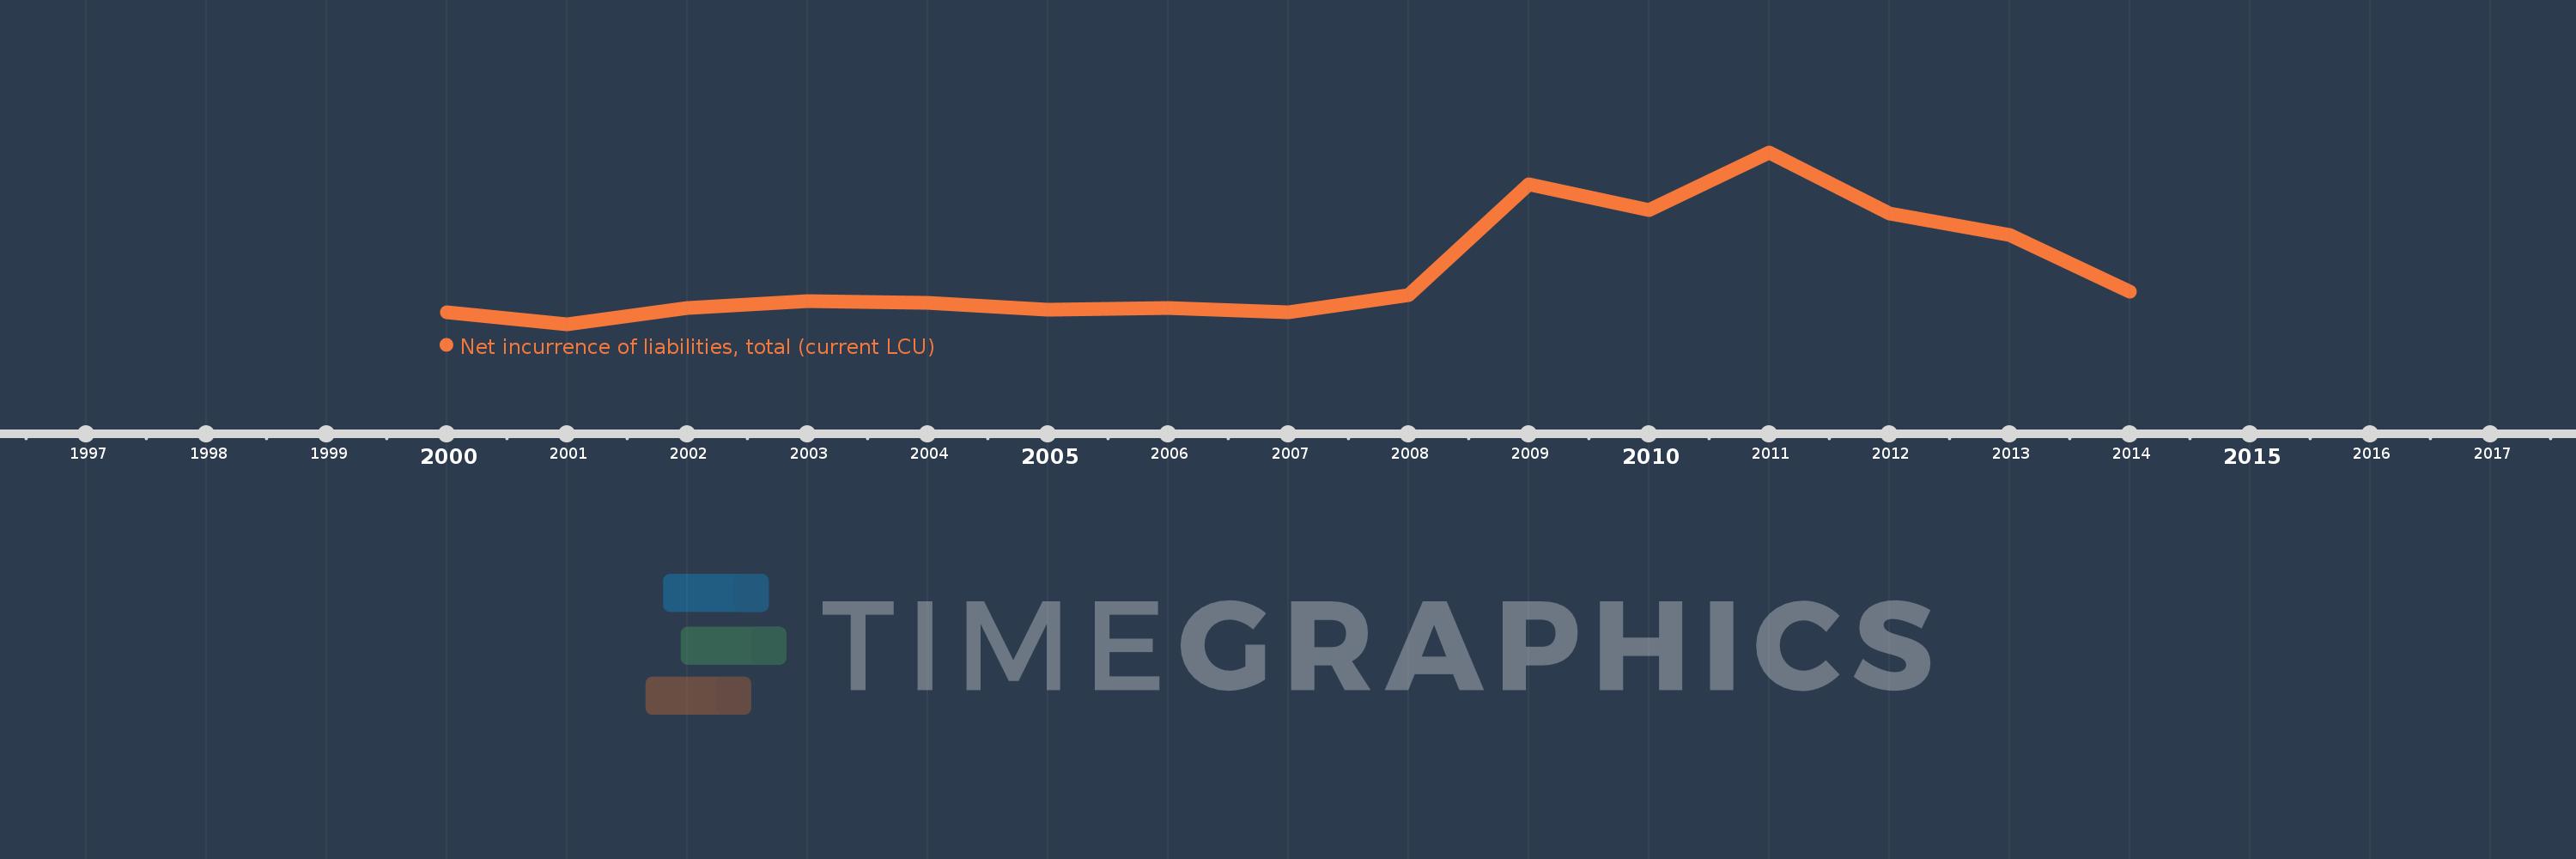
Net incurrence of liabilities, total (current LCU)
2014,2013,2012,2011,2010,2009,2008,2007,2006,2005,2004,2003,2002,2001,2000
This statistics in other country:
Timeline:
This timeline shows a graph from 2000 to 2014 of Ireland. No data until 1999. Number of actual observations by date: 15.
Source name:
World Development Indicators
Source organization:
International Monetary Fund, Government Finance Statistics Yearbook and data files.
Categories, topics:
Public Sector
Last updated:
apr 23, 2017
Indicators value changes by year
Minimum:
-3.819 bln
jan 1, 2001
Maximum:
41.651 bln
jan 1, 2011
At the date of observation
Value
Absolute change
Change from previous value
jan 1, 2000
-749.0 mln
-749.0 mln
0.0%
jan 1, 2001
-3.819 bln
-3.07 bln
409.88%
jan 1, 2002
517.0 mln
+4.336 bln
-113.54%
jan 1, 2003
2.216 bln
+1.699 bln
328.63%
jan 1, 2004
1.847 bln
-369.0 mln
-16.65%
jan 1, 2005
102.0 mln
-1.745 bln
-94.48%
jan 1, 2006
576.0 mln
+474.0 mln
464.71%
jan 1, 2007
-723.0 mln
-1.299 bln
-225.52%
jan 1, 2008
3.874 bln
+4.597 bln
-635.82%
jan 1, 2009
33.193 bln
+29.319 bln
756.81%
jan 1, 2010
26.34 bln
-6.853 bln
-20.65%
jan 1, 2011
41.651 bln
+15.311 bln
58.13%
jan 1, 2012
25.543 bln
-16.108 bln
-38.67%
jan 1, 2013
19.858 bln
-5.685 bln
-22.26%
jan 1, 2014
4.72 bln
-15.138 bln
-76.23%
Ranking of countries by current statistics by years


Comments: