29
/
en
AIzaSyAYiBZKx7MnpbEhh9jyipgxe19OcubqV5w
April 1, 2024
273973
Ukraine
UKR
true
2
1
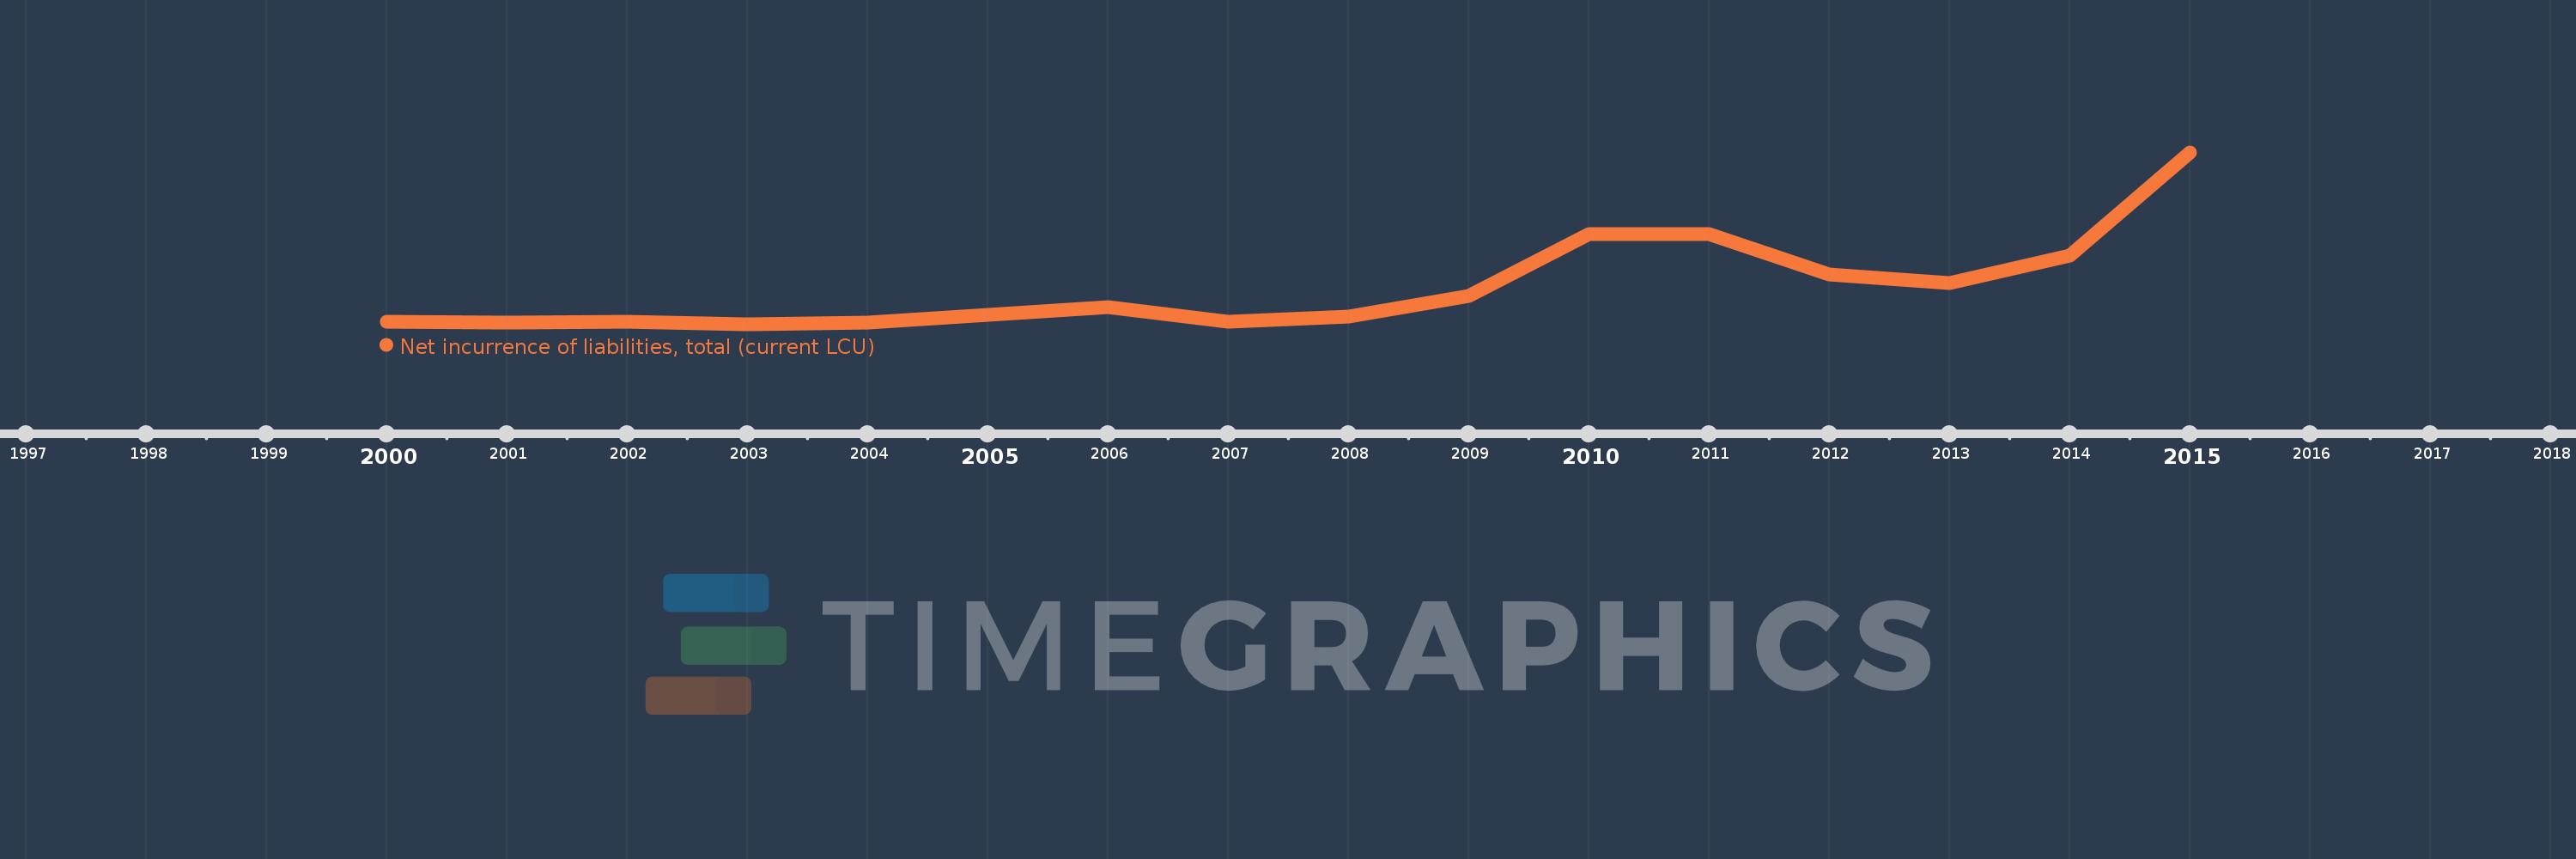
Net incurrence of liabilities, total (current LCU)
2015,2014,2013,2012,2011,2010,2009,2008,2007,2006,2005,2004,2003,2002,2001,2000
This statistics in other country:
Timeline:
This timeline shows a graph from 2000 to 2015 of Ukraine. No data until 1999. Number of actual observations by date: 16.
Source name:
World Development Indicators
Source organization:
International Monetary Fund, Government Finance Statistics Yearbook and data files.
Categories, topics:
Public Sector
Last updated:
apr 23, 2017
Indicators value changes by year
Minimum:
-1.32 mln
jan 1, 2003
Maximum:
202.803 bln
jan 1, 2015
At the date of observation
Value
Absolute change
Change from previous value
jan 1, 2000
2.644 bln
+2.644 bln
0.0%
jan 1, 2001
1.94 bln
-704.3 mln
-26.64%
jan 1, 2002
3.224 bln
+1.284 bln
66.22%
jan 1, 2003
-1.32 mln
-3.225 bln
-100.04%
jan 1, 2004
1.953 bln
+1.954 bln
-148.06K%
jan 1, 2005
10.641 bln
+8.688 bln
444.83%
jan 1, 2006
20.218 bln
+9.577 bln
90.0%
jan 1, 2007
2.576 bln
-17.642 bln
-87.26%
jan 1, 2008
8.901 bln
+6.325 bln
245.47%
jan 1, 2009
33.25 bln
+24.349 bln
273.55%
jan 1, 2010
106.501 bln
+73.251 bln
220.3%
jan 1, 2011
106.575 bln
+73.893 mln
0.07%
jan 1, 2012
58.863 bln
-47.711 bln
-44.77%
jan 1, 2013
48.681 bln
-10.183 bln
-17.3%
jan 1, 2014
81.35 bln
+32.669 bln
67.11%
jan 1, 2015
202.803 bln
+121.453 bln
149.3%
Ranking of countries by current statistics by years


Comments: