29
/
en
AIzaSyAYiBZKx7MnpbEhh9jyipgxe19OcubqV5w
April 1, 2024
111312
Congo, Rep.
COG
true
2
1
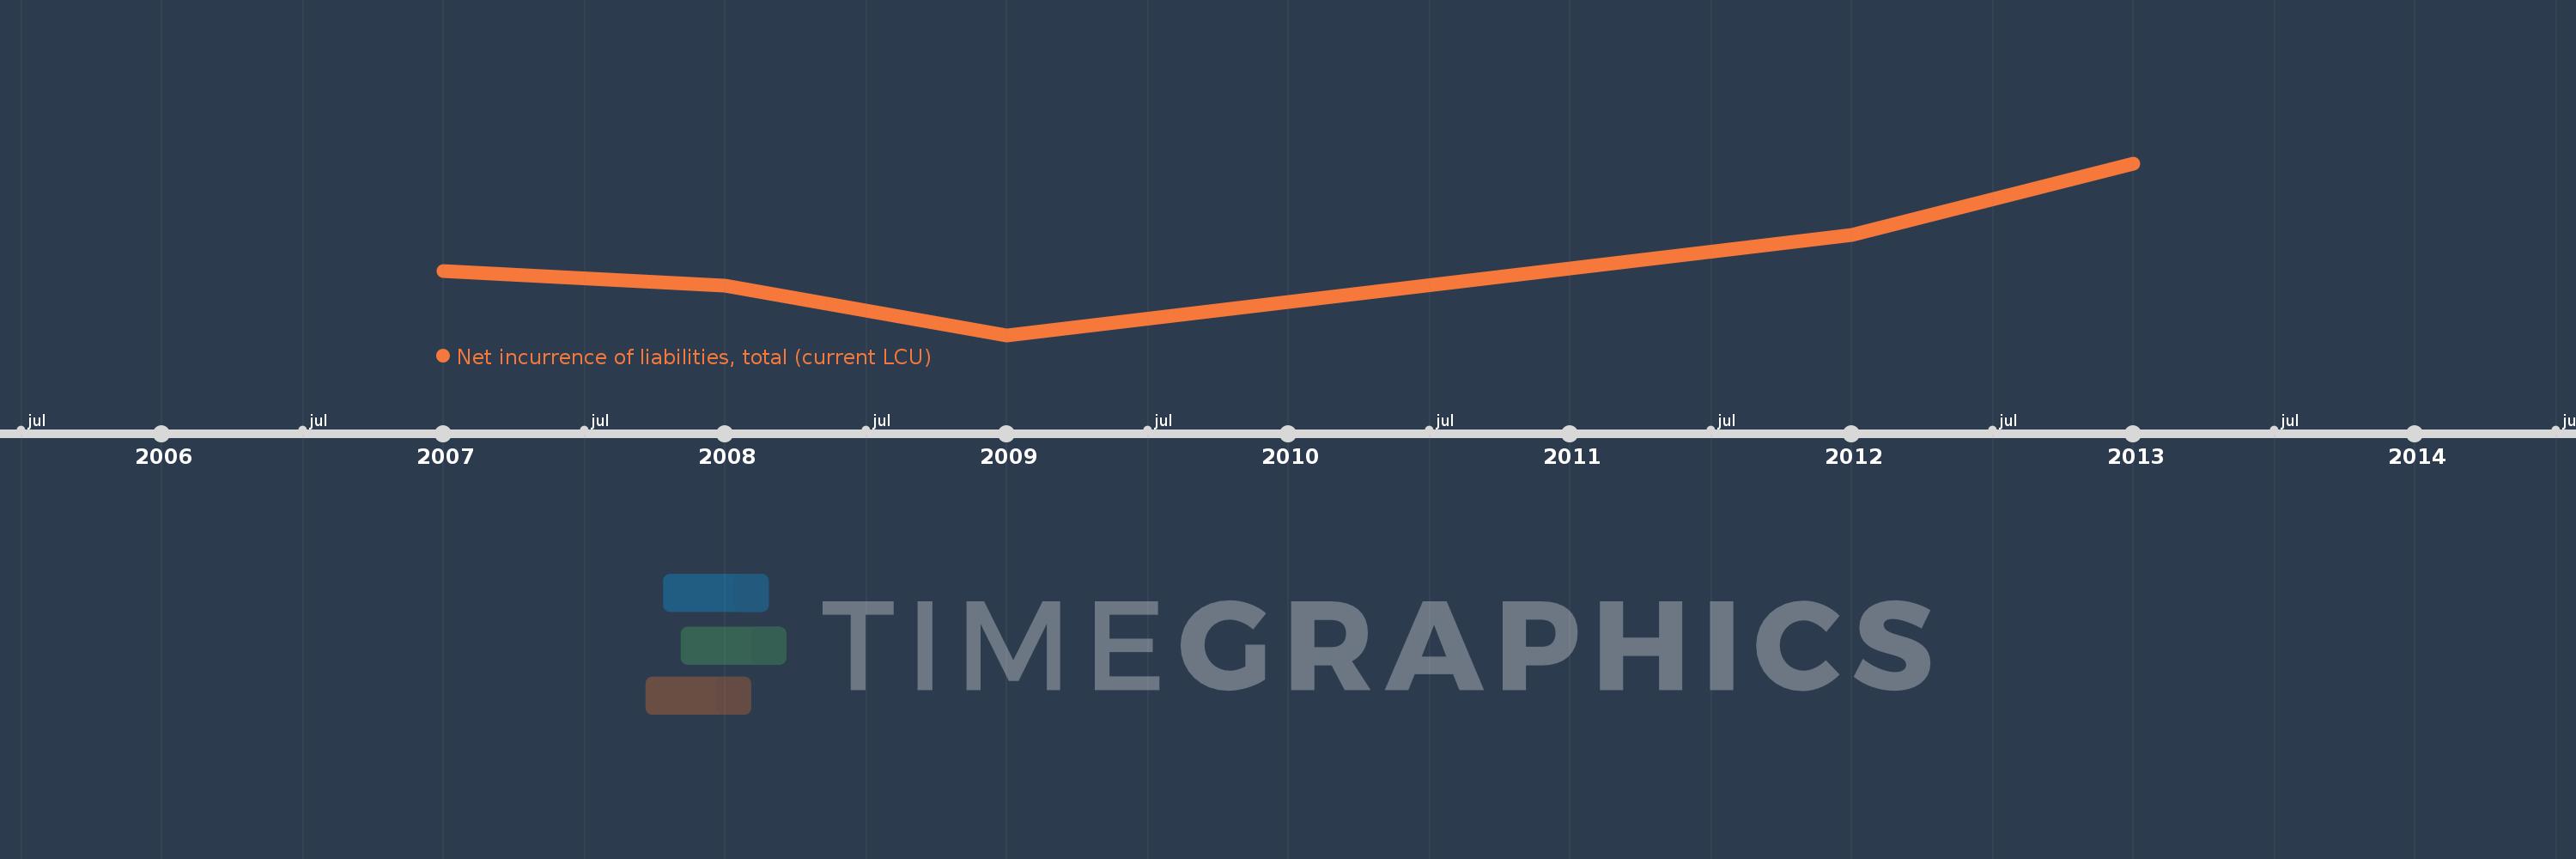
Net incurrence of liabilities, total (current LCU)
2013,2012,2009,2008,2007
This statistics in other country:
Timeline:
This timeline shows a graph from 2007 to 2013 of Congo, Rep.. No data until 2006. Number of actual observations by date: 5.
Source name:
World Development Indicators
Source organization:
International Monetary Fund, Government Finance Statistics Yearbook and data files.
Categories, topics:
Public Sector
Last updated:
apr 23, 2017
Indicators value changes by year
Minimum:
-780.457 bln
jan 1, 2009
Maximum:
495.066 bln
jan 1, 2013
At the date of observation
Value
Absolute change
Change from previous value
jan 1, 2007
-307.627 bln
-307.627 bln
0.0%
jan 1, 2008
-411.021 bln
-103.394 bln
33.61%
jan 1, 2009
-780.457 bln
-369.436 bln
89.88%
jan 1, 2012
-35.153 bln
+745.304 bln
-95.5%
jan 1, 2013
495.066 bln
+530.219 bln
-1.51K%
Ranking of countries by current statistics by years


Comments: