29
/
en
AIzaSyAYiBZKx7MnpbEhh9jyipgxe19OcubqV5w
April 1, 2024
174473
Lao PDR
LAO
true
2
1
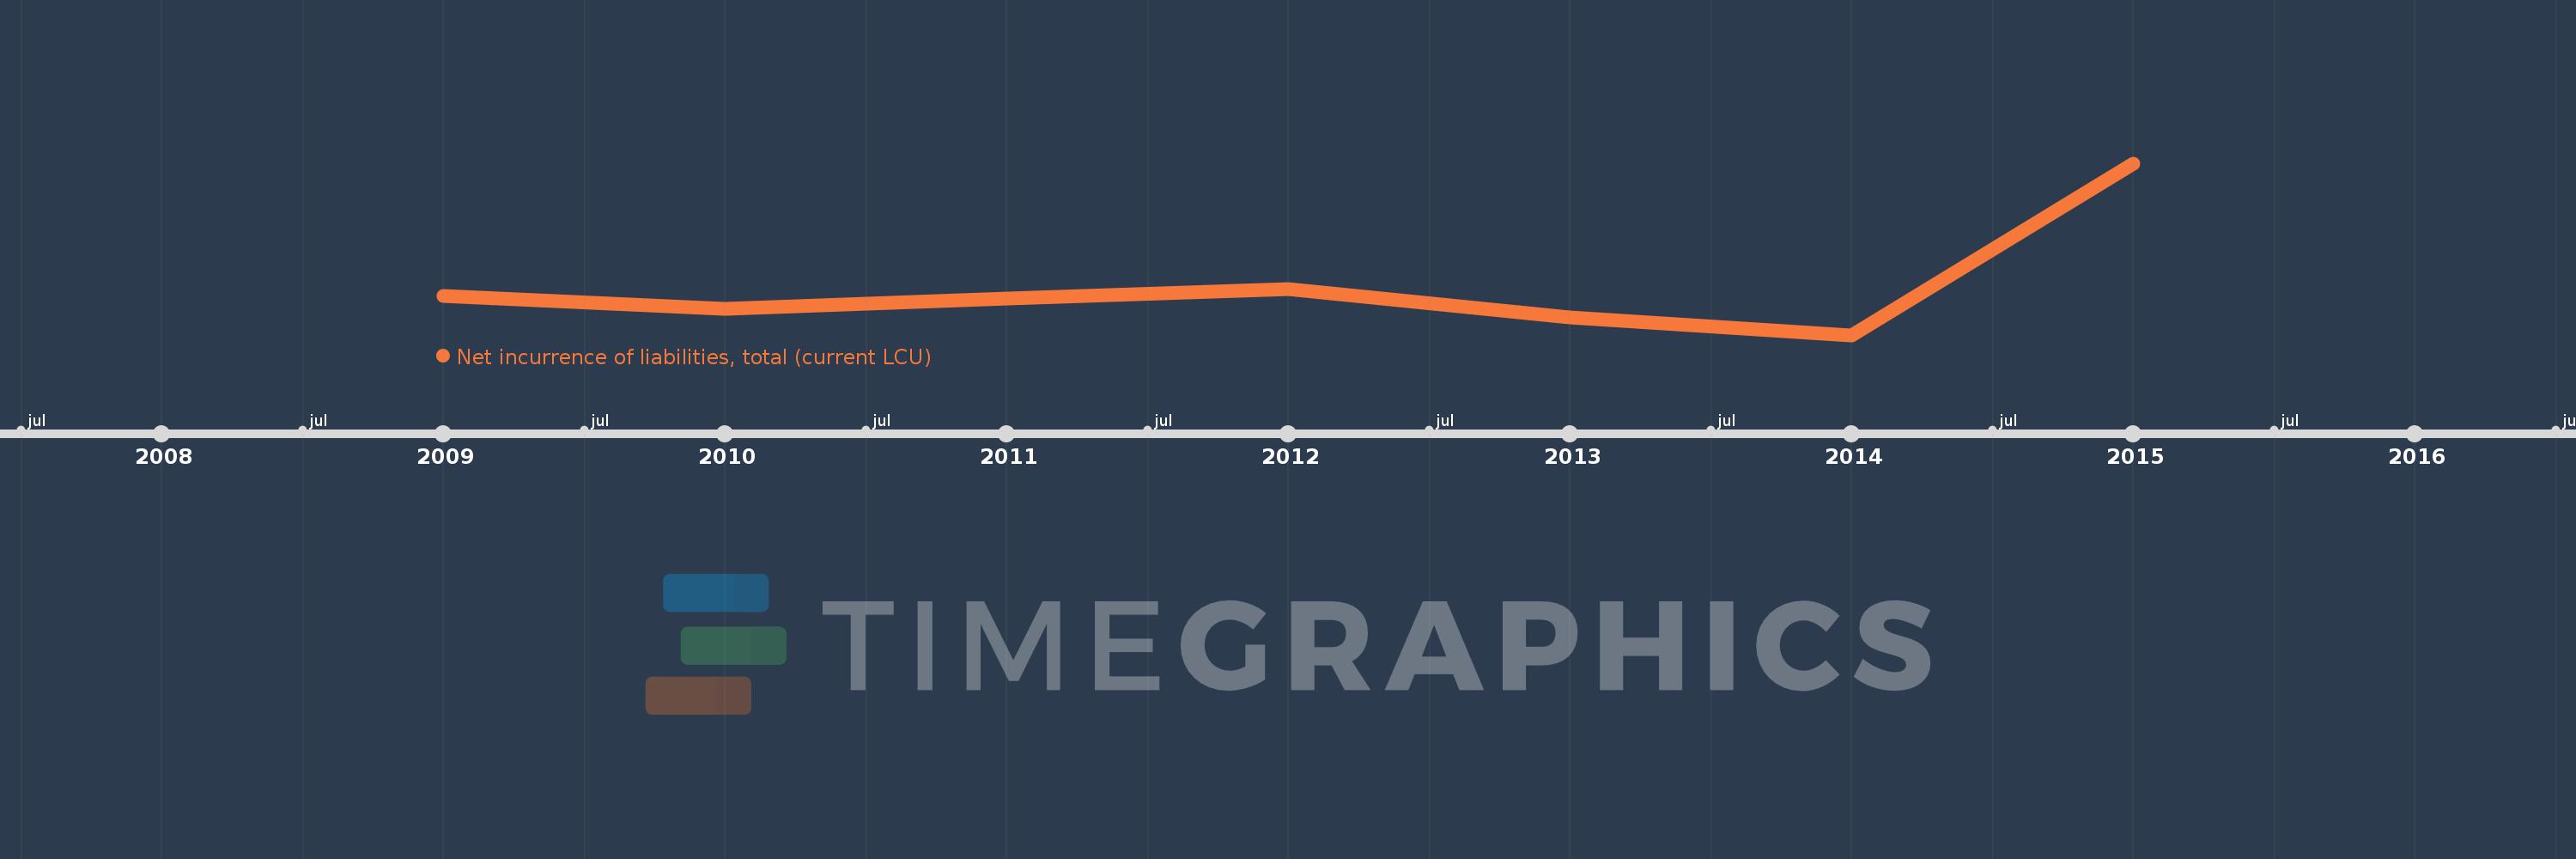
Net incurrence of liabilities, total (current LCU)
2015,2014,2013,2012,2011,2010,2009
This statistics in other country:
Timeline:
This timeline shows a graph from 2009 to 2015 of Lao PDR. No data until 2008. Number of actual observations by date: 7.
Source name:
World Development Indicators
Source organization:
International Monetary Fund, Government Finance Statistics Yearbook and data files.
Categories, topics:
Public Sector
Last updated:
apr 23, 2017
Indicators value changes by year
Minimum:
381.076 bln
jan 1, 2014
Maximum:
3.826 trl
jan 1, 2015
At the date of observation
Value
Absolute change
Change from previous value
jan 1, 2009
1.159 trl
+1.159 trl
0.0%
jan 1, 2010
911.862 bln
-247.508 bln
-21.35%
jan 1, 2011
1.107 trl
+195.308 bln
21.42%
jan 1, 2012
1.307 trl
+199.63 bln
18.03%
jan 1, 2013
738.673 bln
-568.127 bln
-43.47%
jan 1, 2014
381.076 bln
-357.597 bln
-48.41%
jan 1, 2015
3.826 trl
+3.445 trl
904.07%
Ranking of countries by current statistics by years


Comments: