29
/
en
AIzaSyAYiBZKx7MnpbEhh9jyipgxe19OcubqV5w
April 1, 2024
258681
Syrian Arab Republic
SYR
true
2
1
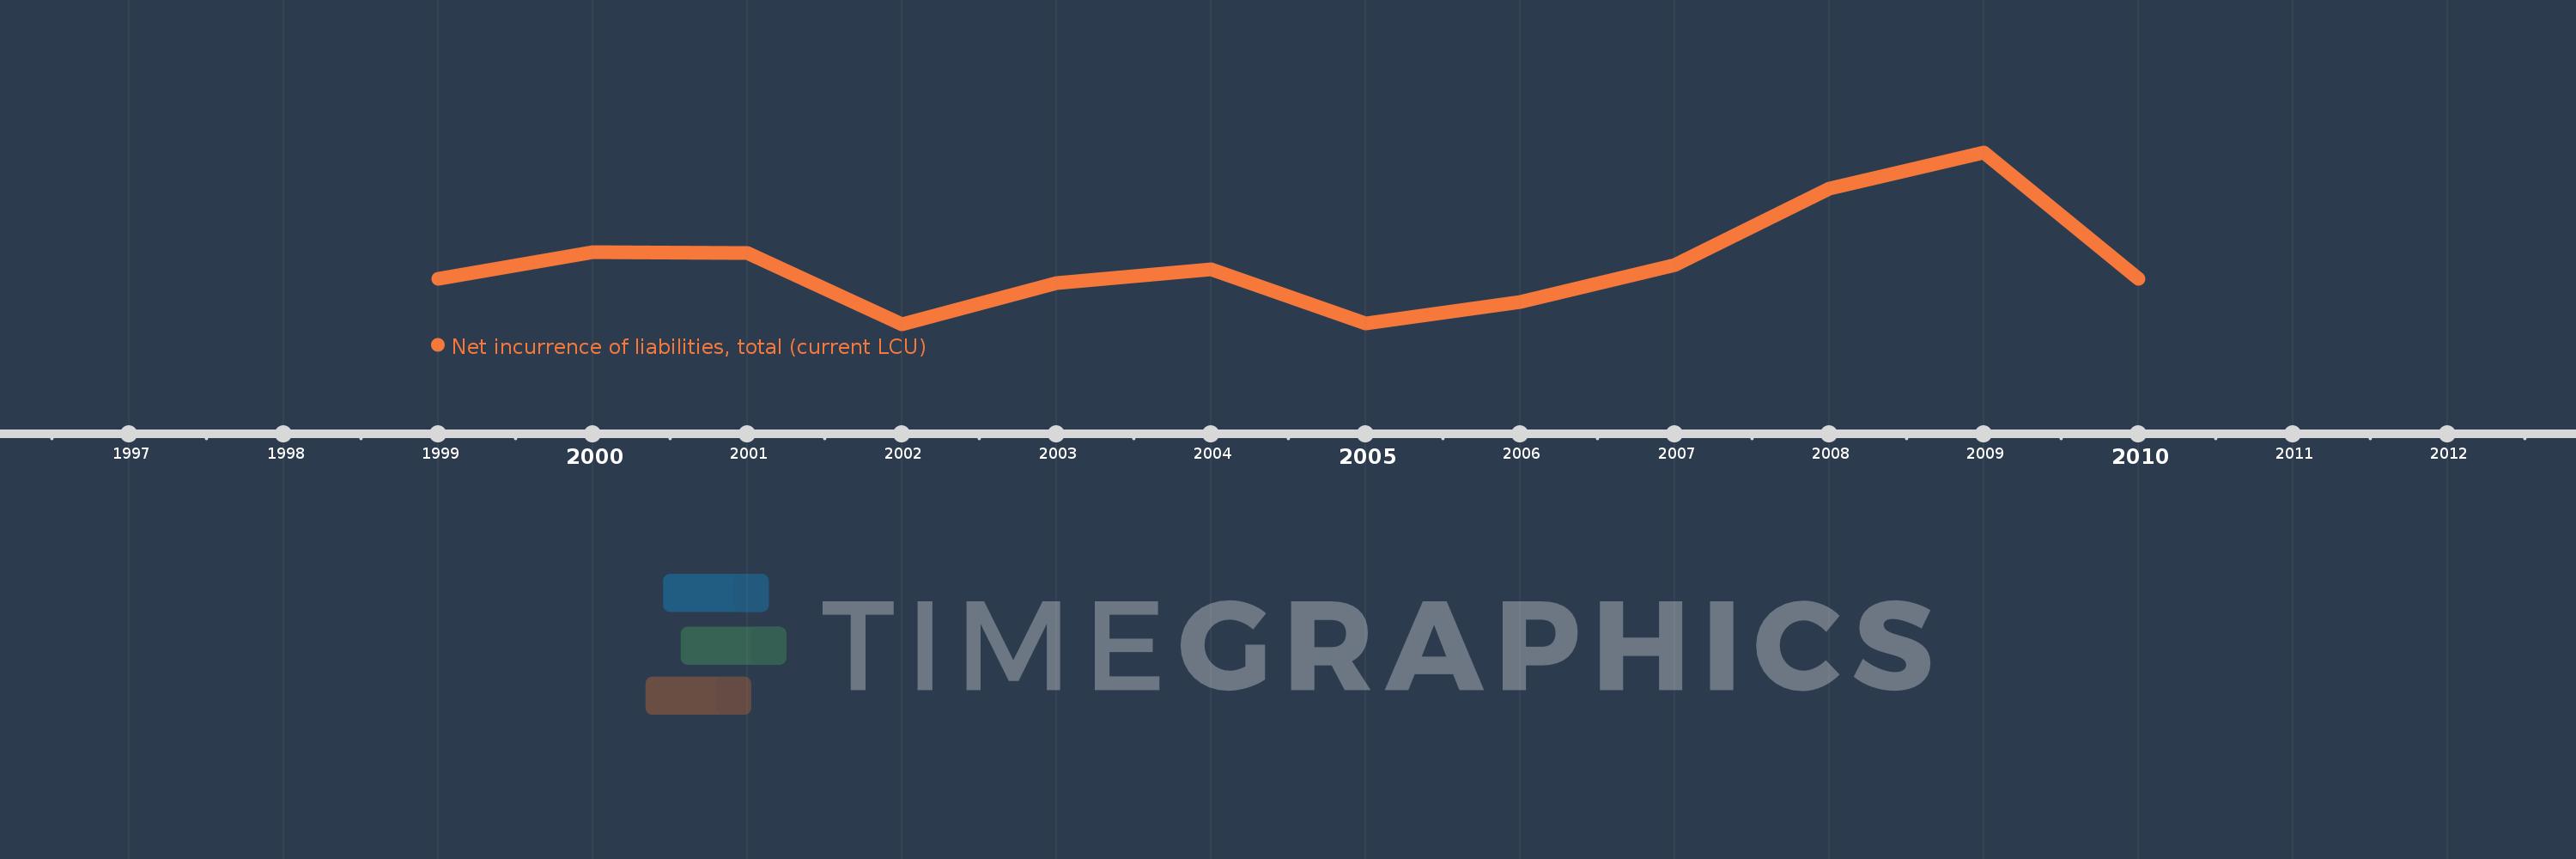
Net incurrence of liabilities, total (current LCU)
2010,2009,2008,2007,2006,2005,2004,2003,2002,2001,2000,1999
This statistics in other country:
Timeline:
This timeline shows a graph from 1999 to 2010 of Syrian Arab Republic. No data until 1998. Number of actual observations by date: 12.
Source name:
World Development Indicators
Source organization:
International Monetary Fund, Government Finance Statistics Yearbook and data files.
Categories, topics:
Public Sector
Last updated:
apr 23, 2017
Indicators value changes by year
Minimum:
2.315 bln
jan 1, 2002
Maximum:
124.971 bln
jan 1, 2009
At the date of observation
Value
Absolute change
Change from previous value
jan 1, 1999
35.006 bln
+35.006 bln
0.0%
jan 1, 2000
53.483 bln
+18.477 bln
52.78%
jan 1, 2001
53.117 bln
-366.0 mln
-0.68%
jan 1, 2002
2.315 bln
-50.802 bln
-95.64%
jan 1, 2003
31.919 bln
+29.604 bln
1.28K%
jan 1, 2004
41.23 bln
+9.311 bln
29.17%
jan 1, 2005
2.951 bln
-38.279 bln
-92.84%
jan 1, 2006
18.233 bln
+15.282 bln
517.86%
jan 1, 2007
44.398 bln
+26.165 bln
143.5%
jan 1, 2008
99.337 bln
+54.939 bln
123.74%
jan 1, 2009
124.971 bln
+25.634 bln
25.81%
jan 1, 2010
35.006 bln
-89.965 bln
-71.99%
Ranking of countries by current statistics by years


Comments: