29
/
en
AIzaSyAYiBZKx7MnpbEhh9jyipgxe19OcubqV5w
April 1, 2024
139576
Germany
DEU
true
2
1
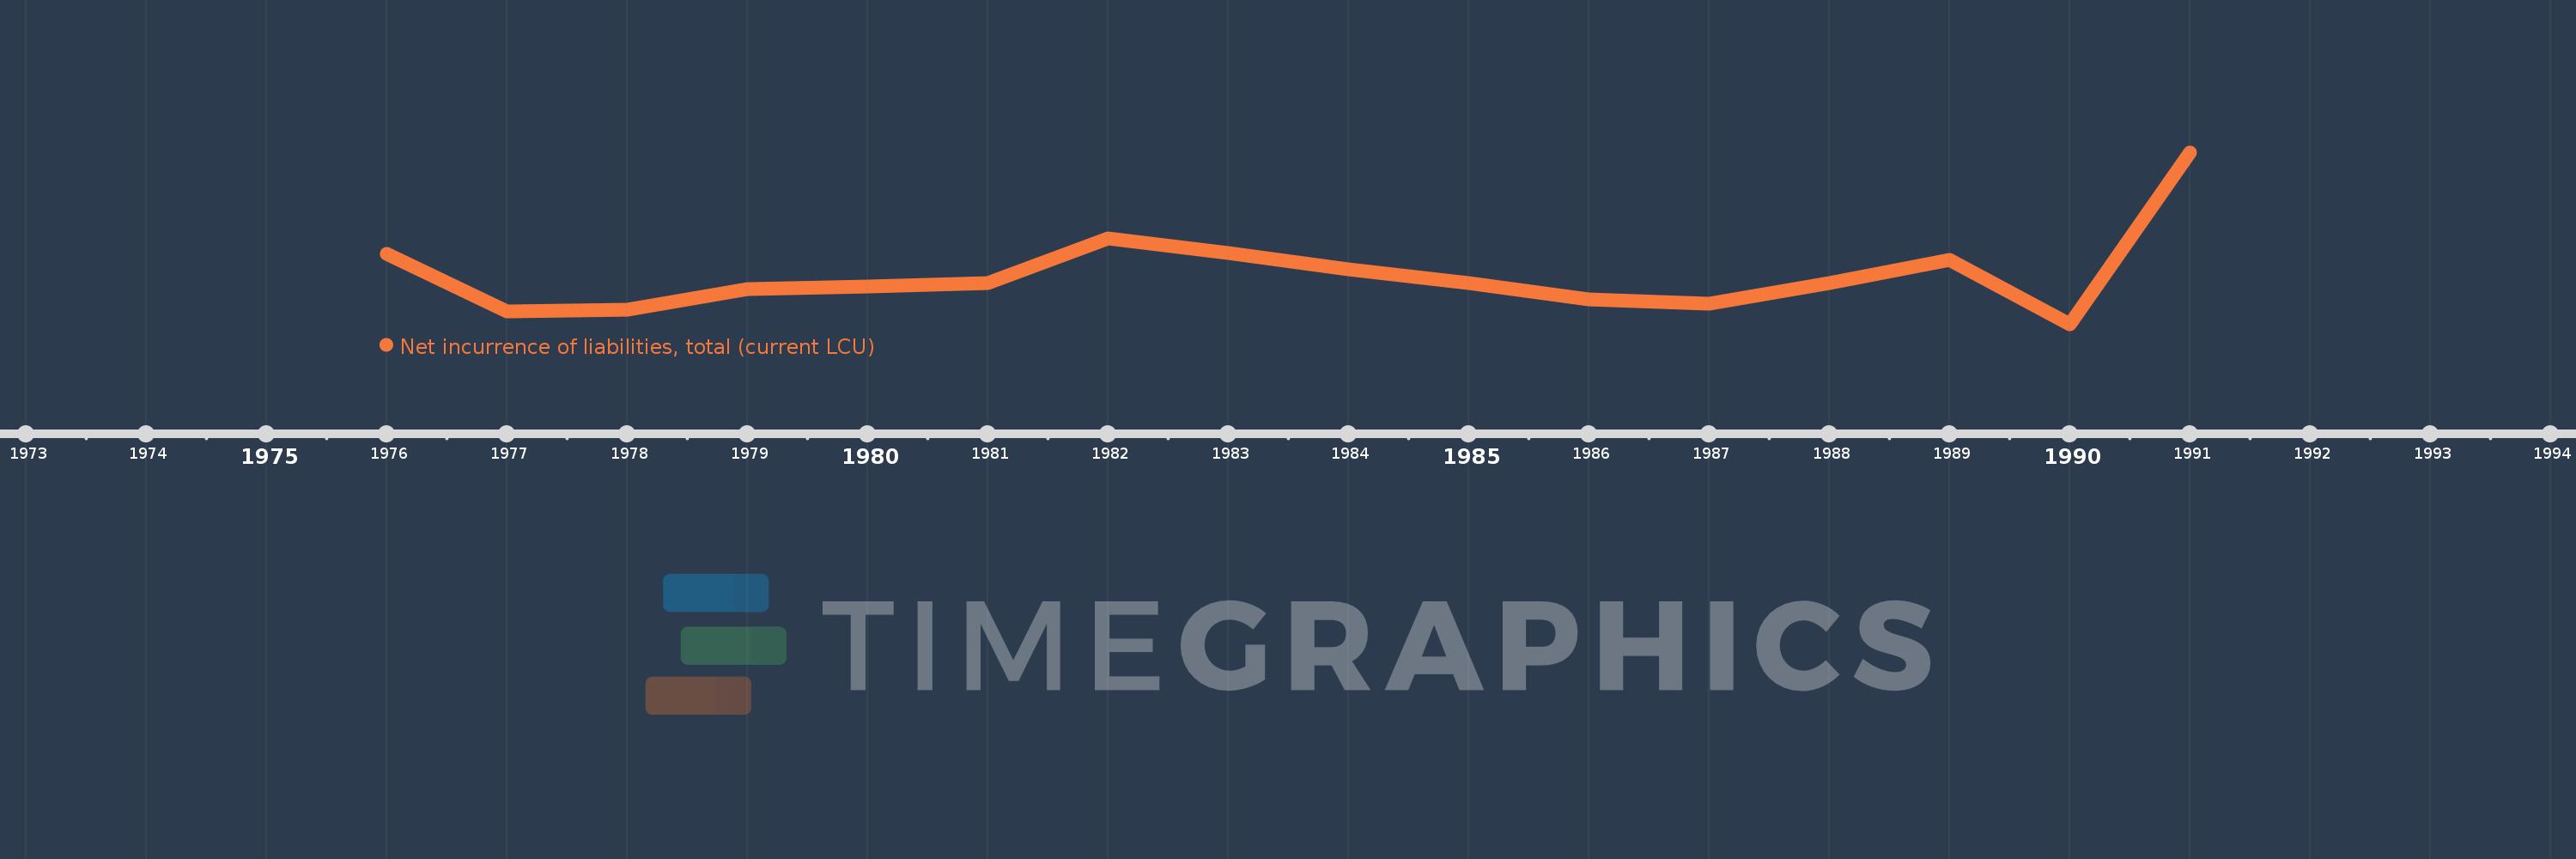
Net incurrence of liabilities, total (current LCU)
1991,1990,1989,1988,1987,1986,1985,1984,1983,1982,1981,1980,1979,1978,1977,1976
This statistics in other country:
Timeline:
This timeline shows a graph from 1976 to 1991 of Germany. No data until 1975. Number of actual observations by date: 16.
Source name:
World Development Indicators
Source organization:
International Monetary Fund, Government Finance Statistics Yearbook and data files.
Categories, topics:
Public Sector
Last updated:
apr 23, 2017
Indicators value changes by year
Minimum:
8.38 bln
jan 1, 1990
Maximum:
33.254 bln
jan 1, 1991
At the date of observation
Value
Absolute change
Change from previous value
jan 1, 1976
18.555 bln
+18.555 bln
0.0%
jan 1, 1977
10.216 bln
-8.339 bln
-44.94%
jan 1, 1978
10.497 bln
+281.211 mln
2.75%
jan 1, 1979
13.457 bln
+2.96 bln
28.2%
jan 1, 1980
13.892 bln
+434.598 mln
3.23%
jan 1, 1981
14.321 bln
+429.485 mln
3.09%
jan 1, 1982
20.769 bln
+6.447 bln
45.02%
jan 1, 1983
18.729 bln
-2.04 bln
-9.82%
jan 1, 1984
16.269 bln
-2.459 bln
-13.13%
jan 1, 1985
14.332 bln
-1.938 bln
-11.91%
jan 1, 1986
12.01 bln
-2.321 bln
-16.2%
jan 1, 1987
11.361 bln
-649.341 mln
-5.41%
jan 1, 1988
14.301 bln
+2.94 bln
25.88%
jan 1, 1989
17.742 bln
+3.441 bln
24.06%
jan 1, 1990
8.38 bln
-9.362 bln
-52.77%
jan 1, 1991
33.254 bln
+24.874 bln
296.83%
Ranking of countries by current statistics by years


Comments: